|

EUR/USD Price Analysis: Downside alleviated above 1.0155

  • EUR/USD reverses three daily gains in a row on Monday.
  • There is an initial resistance at the 7-month line near 1.0160.

EUR/USD comes under some selling pressure and deflates below the parity region at the beginning of the week.

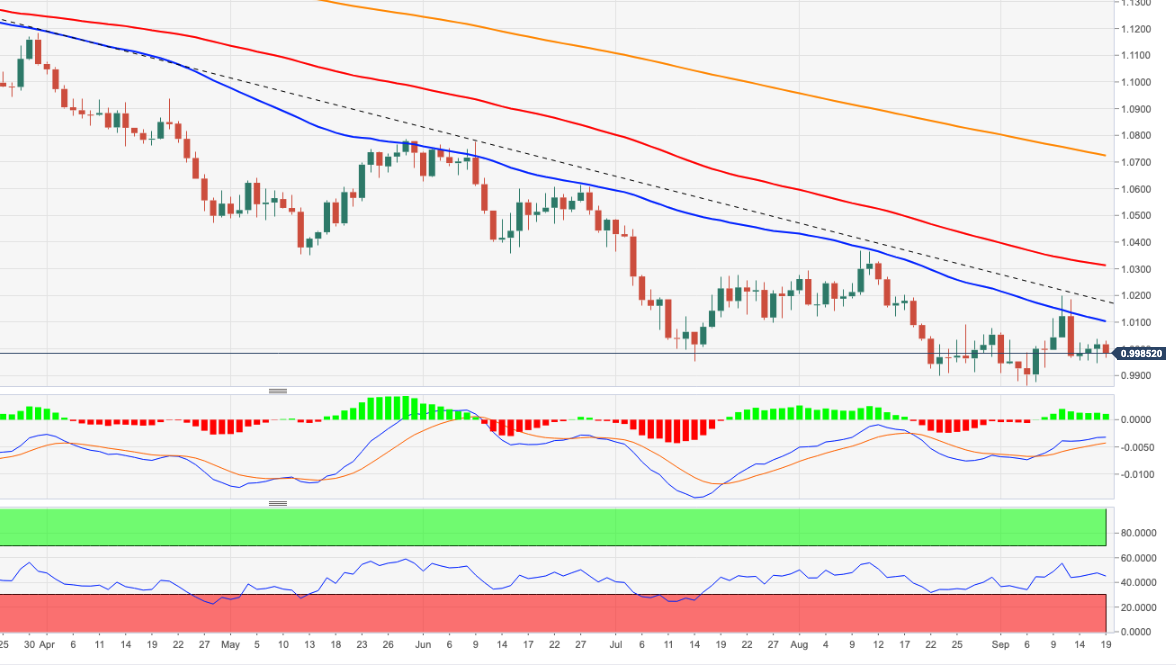
The pair seems to have embarked on a consolidative range ahead of the key FOMC event on Wednesday. Immediately to the upside comes the interim 55-day SMA at 1.0101 ahead of the key 7-month resistance line, today near 1.0160. A move beyond the latter is needed to mitigate the downside pressure and allow spot to confront the September high at 1.0197 (September 12) ahead of potential extra gains.

In the longer run, the pair’s bearish view is expected to prevail as long as it trades below the 200-day SMA at 1.0722.

EUR/USD daily chart

EUR/USD

Overview
Today last price0.9993
Today Daily Change64
Today Daily Change %-0.24
Today daily open1.0017
 
Trends
Daily SMA200.9987
Daily SMA501.0098
Daily SMA1001.0318
Daily SMA2001.0731
 
Levels
Previous Daily High1.0037
Previous Daily Low0.9945
Previous Weekly High1.0198
Previous Weekly Low0.9945
Previous Monthly High1.0369
Previous Monthly Low0.9901
Daily Fibonacci 38.2%1.0002
Daily Fibonacci 61.8%0.998
Daily Pivot Point S10.9963
Daily Pivot Point S20.9908
Daily Pivot Point S30.9871
Daily Pivot Point R11.0054
Daily Pivot Point R21.0091
Daily Pivot Point R31.0146

Author

Pablo Piovano

Born and bred in Argentina, Pablo has been carrying on with his passion for FX markets and trading since his first college years.

More from Pablo Piovano
Share:

Editor's Picks

EUR/USD loses ground below 1.1850 ahead of FOMC Minutes

The EUR/USD pair loses traction near 1.1840 during the early European session on Wednesday, pressured by renewed US Dollar demand. Traders brace for the Federal Open Market Committee Minutes for signals on future rate cuts, which will be released later on Wednesday. 

When is the UK CPI data and how could it affect GBP/USD?

The United Kingdom Consumer Price Index data for January is scheduled to be published today at 07:00 GMT. GBP/USD trades slightly lower at around 1.3556 as of writing. The 20-period Exponential Moving Average trends lower at 1.3593 and continues to cap rebounds. Price holds beneath this gauge, maintaining a short-term bearish bias.

Gold: Is the $5,000 level back in sight?

Gold snaps a two-day downtrend, as recovery gathers traction toward $5,000 on Wednesday. The US Dollar recovers from the overnight sell-off as rebalancing trades resume ahead of Fed Minutes. The 38.2% Fib support holds on the daily chart for now. What does that mean for Gold?

Pi Network rally defies market pressure ahead of its first anniversary

Pi Network is trading above $0.1900 at press time on Wednesday, extending the weekly gains by nearly 8% so far. The steady recovery is supported by a short-term pause in mainnet migration, which reduces pressure on the PI token supply for Centralized Exchanges. The technical outlook focuses on the $0.1919 resistance as bullish momentum increases.

UK jobs market weakens, bolstering rate cut hopes

In the UK, the latest jobs report made for difficult reading. Nonetheless, this represents yet another reminder for the Bank of England that they need to act swiftly given the collapse in inflation expected over the coming months. 

Top 3 Price Prediction: Bitcoin, Ethereum, and Ripple face downside risk as bears regain control

Bitcoin, Ethereum, and Ripple remain under pressure on Wednesday, with the broader trend still sideways. BTC is edging below $68,000, nearing the lower consolidating boundary, while ETH and XRP also declined slightly, approaching their key supports.