|

EUR/USD Price Analysis: Struggles near six-month lows below 1.0650

  • EUR/USD experiences pressure due to the Fed's projection of an additional rate hike in 2023.
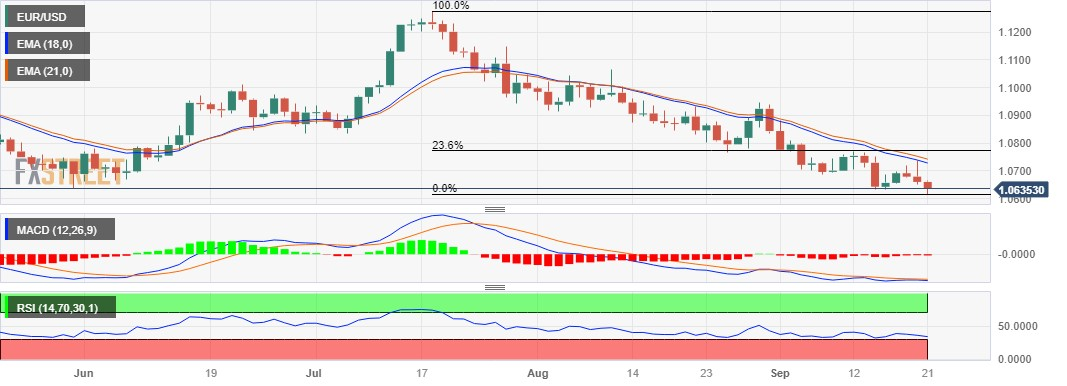
  • MACD line levels with the signal line, suggesting that recent momentum is relatively neutral.
  • Six-month low lined up with the 1.0600 psychological level could act as immediate support.

EUR/USD extends the losses for the third successive day. Spot price is trading lower around 1.0640 during the Asian session on Thursday. As expected, the US Federal Reserve (Fed) chose to maintain the current benchmark policy rates at 5.5% during the meeting convened on Wednesday.

The Fed's projection of an additional rate hike in 2023 has exerted downward pressure on the EUR/USD pair. Furthermore, in its monetary policy statement, the Federal Open Market Committee (FOMC) has indicated an anticipation of slightly higher inflation compared to its previous forecasts.

The six-month low at 1.0616 marked on Thursday could act as immediate support, followed by the 1.0600 psychological level.

On the upside, the 18-day Exponential Moving Average (EMA) at 1.0728 appears to be the key barrier aligned to the 21-day EMA at the 1.0742 level.

A break above the latter could provide support for the pair to navigate the region around the 23.6% Fibonacci retracement at 1.0772, followed by the 1.0800 psychological level.

The Moving Average Convergence Divergence (MACD) line remains below the centerline but is at the same level as the signal line. This configuration suggests that the momentum in the underlying asset's price is relatively neutral, with neither bullish nor bearish dominance.

However, the momentum in the EUR/USD pair indicates bearish sentiment in the market as the 14-day Relative Strength Index (RSI) remains below the 50 level.

EUR/USD: Daily Chart

EUR/USD: additional important levels

Overview
Today last price1.0635
Today Daily Change-0.0025
Today Daily Change %-0.23
Today daily open1.066
 
Trends
Daily SMA201.0753
Daily SMA501.0908
Daily SMA1001.0885
Daily SMA2001.0829
 
Levels
Previous Daily High1.0737
Previous Daily Low1.065
Previous Weekly High1.0769
Previous Weekly Low1.0632
Previous Monthly High1.1065
Previous Monthly Low1.0766
Daily Fibonacci 38.2%1.0683
Daily Fibonacci 61.8%1.0704
Daily Pivot Point S11.0628
Daily Pivot Point S21.0596
Daily Pivot Point S31.0541
Daily Pivot Point R11.0715
Daily Pivot Point R21.0769
Daily Pivot Point R31.0802

Author

Akhtar Faruqui

Akhtar Faruqui is a Forex Analyst based in New Delhi, India. With a keen eye for market trends and a passion for dissecting complex financial dynamics, he is dedicated to delivering accurate and insightful Forex news and analysis.

More from Akhtar Faruqui
Share:

Markets move fast. We move first.

Orange Juice Newsletter brings you expert driven insights - not headlines. Every day on your inbox.

By subscribing you agree to our Terms and conditions.

Editor's Picks

EUR/USD stays defensive below 1.1750 as USD finds its feet

EUR/USD kicks off the new week on a softer note, holding below 1.1750 in European trading on Monday. The pair faces challenges due to a pause in the US Dollar downtrend, with traders shifting their focus to the delayed US Nonfarm Payrolls and CPI data for fresh directives. The ECB policy decision is also eagerly awaited. 

GBP/USD holds steady above 1.3350 as traders await key data and BoE

GBP/USD remains on the back foot above 1.3350 in the European session on Monday, though it lacks bearish conviction and holds above the key 200-day SMA support. The US Dollar holds its recovery mode ahead of key data releases, while the Pound Sterling faces headwinds from the expected BoE rate cut this week. 

Gold climbs to seven-week highs on Fed rate cut bets, safe-haven demand

Gold price rises to seven-week highs to near $4,350 during the early European trading hours on Monday. The precious metal extends its upside amid the prospect of interest rate cuts by the US Fed next year. Lower interest rates could reduce the opportunity cost of holding Gold, supporting the non-yielding precious metal.

Solana consolidates as spot ETF inflows near $1 billion signal institutional dip-buying

Solana price hovers above $131 at the time of writing on Monday, nearing the upper boundary of a falling wedge pattern, awaiting a decisive breakout. On the institutional side, demand for spot Solana Exchange-Traded Funds remained firm, pushing total assets under management to nearly $1 billion since launch. 

Big week ends with big doubts

The S&P 500 continued to push higher yesterday as the US 2-year yield wavered around the 3.50% mark following a Federal Reserve (Fed) rate cut earlier this week that was ultimately perceived as not that hawkish after all. The cut is especially boosting the non-tech pockets of the market.

Solana Price Forecast: SOL consolidates as spot ETF inflows near $1 billion signal institutional dip-buying

Solana (SOL) price hovers above $131 at the time of writing on Monday, nearing the upper boundary of a falling wedge pattern, awaiting a decisive breakout.