|

EUR/USD Price Analysis: Struggles at 1.1020, regardless of a morning-star emerging

  • EUR/USD remains below the key 1.1000/1.1018 resistance area, hindered by the 20-day EMA and a one-month-old resistance trendline.
  • The currency pair is trading at 1.1007, showing a slight decrease of 0.01% ahead of the Wall Street closing bell.
  • Despite the emergence of a ‘morning-star’ three-candlestick chart pattern suggesting upward momentum, Monday’s doji formation signals hesitancy among buyers.
  • Key resistance lies at 1.1020, with potential for movement towards 1.1055 and 1.1095, while support can be found at 1.0947 and 1.0933.

The EUR/USD erases some of its earlier losses but remains capped by the 20-day Exponential Moving Average (EMA) intersection with a resistance trendline at around the 1.1000/1.1018 area. The EUR/USD exchanges hands at 1.1007, down 0.01% ahead of the Wall Street close.

EUR/USD Price Analysis: Technical outlook

From a daily chart perspective, the EUR/USD should be headed upward as a ‘morning-star’ three-candlestick chart pattern emerges. But Monday’s price action forming a doji indicates buyers are struggling to gather momentum, which could lose control to sellers if the EUR/USD falls below 1.1000.

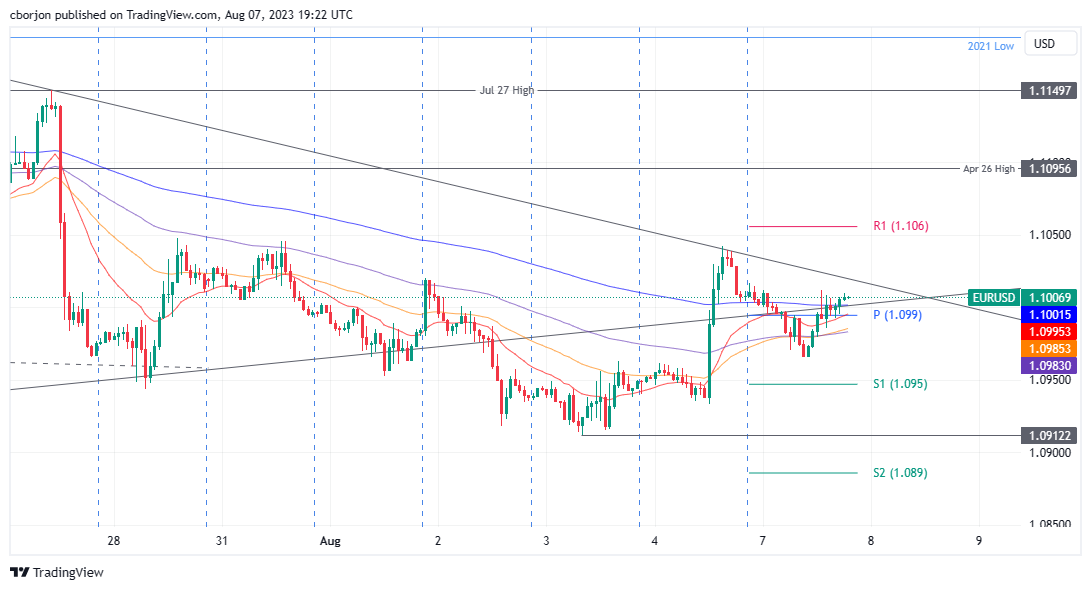
From a short-term standpoint, the EUR/USD is tilted upward, but a one-month-old resistance trendline would be difficult to surpass as the pair edges higher. A breach of 1.1020 will put into play the R1 daily pivot at 1.1055, followed by the April 26 high at 1.1095 ahead of 1.1100.

On the other hand, if EUR/USD tumbles below 1.1000, the following support would be the S1 pivot point at 1.0947, followed by last Friday’s low of 1.0933. Failure to crack the latter could spark an upward correction, as the EUR/USD could fail to achieve a new lower low. A continuation could pave the way to challenge 1.0900.

EUR/USD Price Action - Hourly chart

EUR/USD Hourly chart

EUR/USD

Overview
Today last price1.1006
Today Daily Change-0.0003
Today Daily Change %-0.03
Today daily open1.1009
 
Trends
Daily SMA201.108
Daily SMA501.0937
Daily SMA1001.092
Daily SMA2001.0745
 
Levels
Previous Daily High1.1042
Previous Daily Low1.0935
Previous Weekly High1.1046
Previous Weekly Low1.0912
Previous Monthly High1.1276
Previous Monthly Low1.0834
Daily Fibonacci 38.2%1.1001
Daily Fibonacci 61.8%1.0976
Daily Pivot Point S11.0948
Daily Pivot Point S21.0888
Daily Pivot Point S31.0841
Daily Pivot Point R11.1055
Daily Pivot Point R21.1102
Daily Pivot Point R31.1162

Author

Christian Borjon Valencia

Markets analyst, news editor, and trading instructor with over 14 years of experience across FX, commodities, US equity indices, and global macro markets.

More from Christian Borjon Valencia
Share:

Editor's Picks

EUR/USD remains on the back foot around 1.1700

EUR/USD is coming under heavy selling pressure, hovering around the 1.1700 region in the latter part of the NA session on Monday. The pair’s severe retracement comes as the US Dollar stages a marked bounce on the back of the prevailing flight to safety atmosphere, as investors react to the escalating conflict in the Middle East.

GBP/USD hits new yearly lows near 1.3300

GBP/USD adds to the recent bearish tone, approaching to the key 1.3300 support to reach fresh YTD troughs against the backdrop of the robust performance of the US Dollar. Indeed, Cable’s decline comes amid the firm demand for the safe-haven space in the wake of the US and Israel attacks to Iran.

Gold eases some ground, approaches $5,300

Gold now surrenders part of the earlier advance, reshifting its attenton to the $5,300 zone per troy ounce at the beginning of the week. Indeed, the yellow metal’s firm performance appears propped up by incresing geopolitical jitters in the Middle East, which at the same time fuels the demand for the safe-haven space.

Bitcoin on brink of breakdown amid US-Iran war

Bitcoin (BTC) remains under pressure near the key support level of $65,700. Trading at $66,400 at the time of writing on Monday, a breakdown below this critical level would suggest a deeper correction ahead.

The Fed is finally talking about AI – Here's why it matters for the US Dollar

AI is moving from earnings calls into the heart of monetary policy discussions, forcing Federal Reserve officials to confront a new question: How to act if AI reshapes inflation, employment and interest rates at the same time?

Grass 20% bullish breakout defies broader market weakness

Grass (GRASS) is edging up above $0.30 at the time of writing on Monday. The token’s notable 20% intraday surge stands out amid heightened volatility in the broader crypto market.