|

EUR/USD Price Analysis: Stays inside familiar range surrounding 0.9700

  • EUR/USD remains sidelined in an immediate 70-pip trading region.
  • Sluggish MACD, RSI also back sideways performance between three-week-old horizontal support and descending resistance line from October 06.
  • Bears have a comparatively smoother road to return than buyers.

EUR/USD treads water around 0.9700, staying inside a familiar 70-pip trading range during Thursday’s Asian session. In doing so, the major currency pair portrays the typical pre-data trading lull ahead of the US Consumer Price Index (CPI) data for September.

That said, a three-week-old horizontal line restricts the EUR/USD pair’s immediate downside around 0.9670 while a one-week-long descending trend line joins the 23.6% Fibonacci retracement level of the August-September downside, near 0.9740 to challenge buyers.

It’s worth noting that the RSI (14) and the MACD also portray sluggish markets and hence it all depends upon the scheduled US inflation data.

Even so, the EUR/USD bears might have a quick fall towards the yearly low of 0.9537 on breaking 0.9670 support, which appears smoother than the likely hardships for buyers due to multiple hurdles in the north.

If the quote remains weak past 0.9670, the 61.8% Fibonacci Expansion (FE) of the August-October moves, near 0.9480, will be in focus.

Alternatively, an upside clearance of the 0.9740 hurdle will need validation from the recent swing high near 0.9775 to convince buyers.

Following that, the 38.2% Fibonacci retracement level of 0.9853 and the monthly high near the parity could challenge the EUR/USD pair buyers.

EUR/USD: Four-hour chart
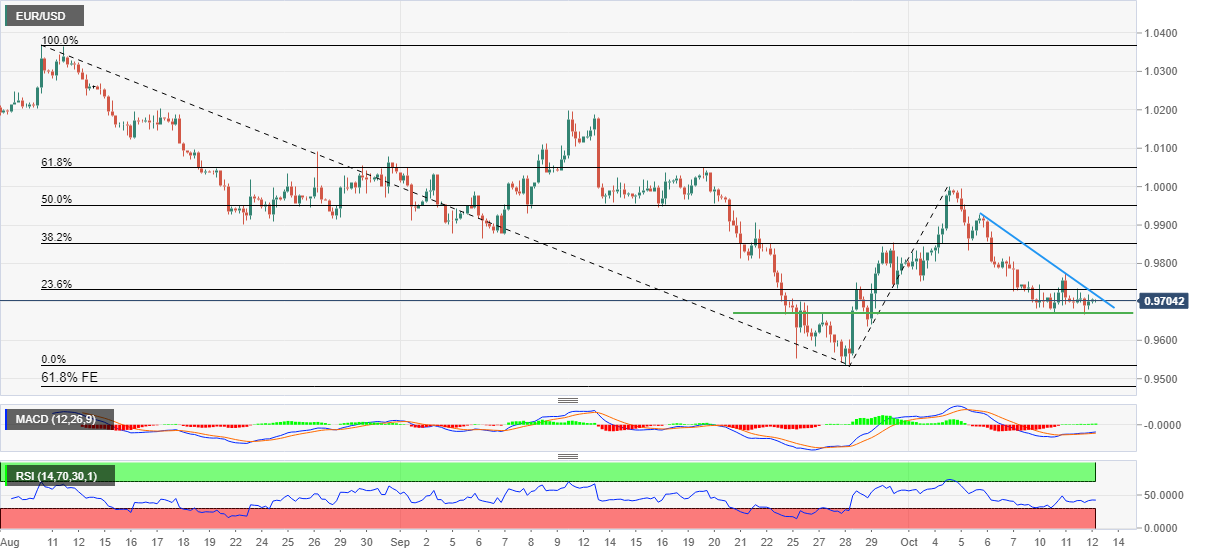
Trend: Sideways

Additional important levels

Overview
Today last price0.9705
Today Daily Change0.0002
Today Daily Change %0.02%
Today daily open0.9703
 
Trends
Daily SMA200.9813
Daily SMA500.9967
Daily SMA1001.0181
Daily SMA2001.0594
 
Levels
Previous Daily High0.9735
Previous Daily Low0.9668
Previous Weekly High1
Previous Weekly Low0.9726
Previous Monthly High1.0198
Previous Monthly Low0.9536
Daily Fibonacci 38.2%0.9694
Daily Fibonacci 61.8%0.9709
Daily Pivot Point S10.9669
Daily Pivot Point S20.9635
Daily Pivot Point S30.9602
Daily Pivot Point R10.9736
Daily Pivot Point R20.9769
Daily Pivot Point R30.9803

Author

Anil Panchal

Anil Panchal

FXStreet

Anil Panchal has nearly 15 years of experience in tracking financial markets. With a keen interest in macroeconomics, Anil aptly tracks global news/updates and stays well-informed about the global financial moves and their implications.

More from Anil Panchal
Share:

Editor's Picks

EUR/USD revisits 1.1780, or daily lows

EUR/USD now comes under further selling pressure, breaking below the 1.1800 support to reach daily troughs on Thursday. The pair’s decline comes in response to a sudden bout of USD strength amid steady geopolitical tensions. Ealier in the day, the ECB’s Lagarde delivered cautious remarks, although the currency remained apathetic.

GBP/USD makes a U-turn, challenges 1.3500

GBP/USD rapidly leaves behind Wednesday’s strong advance, putting the 1.3500 support to the test on Thursday. Cable’s deep pullback follows the strong gains in the Greenback, while investors continue to pencil in a potential BoE rate cut in March.

Gold sticks to the bid bias, flirts with $5,200

Gold is now facing some downside pressure, hovering around the $5,170 region on Thursday. The precious metal adds to Wednesday’s optimism despite the Greenback trades in a firm fashion, although geopolitical tensions in the Middle East keep the yellow metal bid for now.

Stellar: Relief bounce fades as bearish undertone persists

Stellar is trading around $0.16 at the time of writing on Thursday after rebounding more than 8% in the previous day. Derivatives data paints a negative picture as XLM’s short bets hit a monthly high while Open Interest continues to decline.

The one thing everyone is on the lookout for is US action of some sort against Iran

The FX market is minestrone soup these days. It is befuddled by conflicting data, rumors and small stories exaggerated out of proportion, and Trump-generated uncertainty. 

Bitcoin steadies as traders eye US–Iran talks

Bitcoin (BTC) price is stabilizing around $68,000 at the time of writing on Thursday after a 6.2% relief rally the previous day amid a broader downward trend.