- EUR/USD lacks any firm intraday direction and oscillates in a narrow range on Monday.
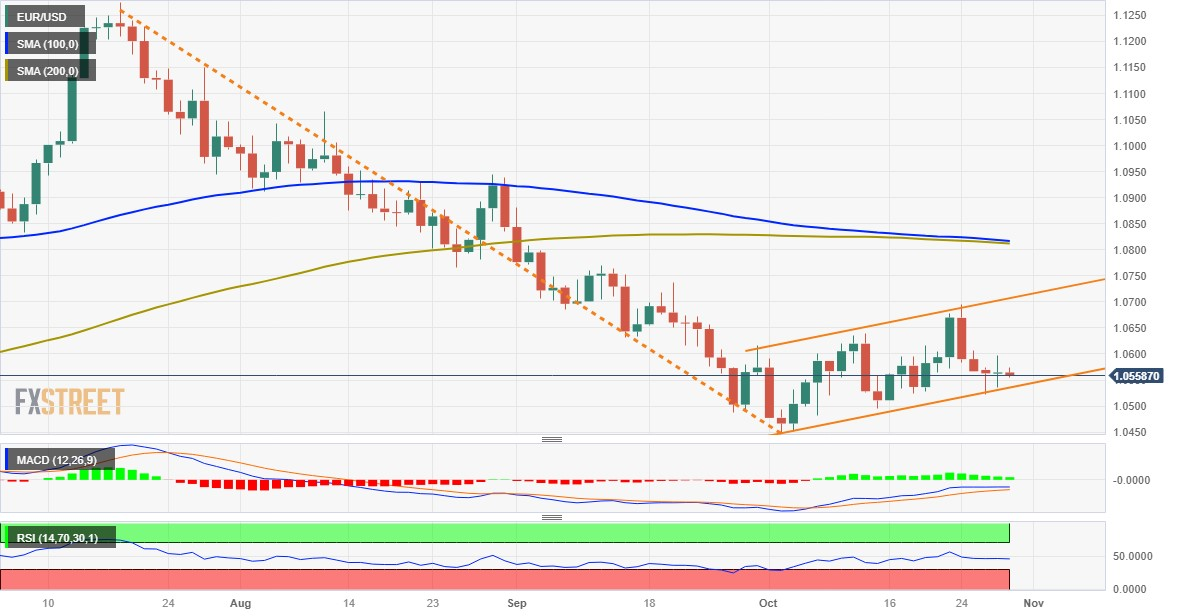
- The formation of a bearish flag pattern supports prospects for some meaningful decline.
- A sustained strength beyond the 1.0700 mark is needed to negate the negative outlook.
The EUR/USD pair struggles to gain any meaningful traction on Monday and remains confined in a narrow trading band, just above mid-1.0500s through the Asian session.
The US economic resilience keeps the door open for one more rate hike by the Federal Reserve (Fed) and remains supportive of elevated US Treasury bond yields. This, in turn, is seen acting as a tailwind for the US Dollar (USD), which, along with the European Central Bank's (ECB) dovish outlook, continues to cap the upside for the EUR/USD pair.
From a technical perspective, the recent recovery from the 1.0445-1.0450 region, or the YTD low, has been along an upward-sloping channel. Against the backdrop of a sharp fall from a 17-month peak touched in June, this constitutes the formation of a bearish flag pattern and suggests that the path of least resistance for the EUR/USD pair is to the downside.
Moreover, negative oscillators on the daily chart add credence to the bearish outlook. That said, it will still be prudent to wait for a convincing break below the ascending channel support, around the 1.0540-1.0535 region, before positioning for a slide towards the 1.0500 mark. The EUR/USD pair could eventually drop to restest the 1.0450-1.0445 area or the YTD trough.
On the flip side, Friday's swing high, nearing the 1.0600 mark, now seems to act as an immediate hurdle. A sustained strength beyond has the potential to lift the EUR/USD pair towards the 1.0665-1.0670 intermediate resistance en route to the top end of the aforementioned trend channel, currently pegged just ahead of the 1.0700 round-figure mark.
The latter should act as a key pivotal point for short-term traders, which if cleared decisively will negate the bearish flag pattern and prompt aggressive short-covering move. The EUR/USD pair then aim to surpass the 1.0800 mark and challenge the 1.0810-1.0815 confluence, comprising the 100-day and the 200-day Simple Moving Averages (SMAs).
EUR/USD daily chart
Technical levels to watch
Information on these pages contains forward-looking statements that involve risks and uncertainties. Markets and instruments profiled on this page are for informational purposes only and should not in any way come across as a recommendation to buy or sell in these assets. You should do your own thorough research before making any investment decisions. FXStreet does not in any way guarantee that this information is free from mistakes, errors, or material misstatements. It also does not guarantee that this information is of a timely nature. Investing in Open Markets involves a great deal of risk, including the loss of all or a portion of your investment, as well as emotional distress. All risks, losses and costs associated with investing, including total loss of principal, are your responsibility. The views and opinions expressed in this article are those of the authors and do not necessarily reflect the official policy or position of FXStreet nor its advertisers. The author will not be held responsible for information that is found at the end of links posted on this page.
If not otherwise explicitly mentioned in the body of the article, at the time of writing, the author has no position in any stock mentioned in this article and no business relationship with any company mentioned. The author has not received compensation for writing this article, other than from FXStreet.
FXStreet and the author do not provide personalized recommendations. The author makes no representations as to the accuracy, completeness, or suitability of this information. FXStreet and the author will not be liable for any errors, omissions or any losses, injuries or damages arising from this information and its display or use. Errors and omissions excepted.
The author and FXStreet are not registered investment advisors and nothing in this article is intended to be investment advice.
Recommended content
Editors’ Picks

EUR/USD holds above 1.0400 in quiet trading
EUR/USD trades in positive territory above 1.0400 in the American session on Friday. The absence of fundamental drivers and thin trading conditions on the holiday-shortened week make it difficult for the pair to gather directional momentum.

GBP/USD recovers above 1.2550 following earlier decline
GBP/USD regains its traction and trades above 1.2550 after declining toward 1.2500 earlier in the day. Nevertheless, the cautious market mood limits the pair's upside as trading volumes remain low following the Christmas break.

Gold declines below $2,620, erases weekly gains
Gold edges lower in the second half of the day and trades below $2,620, looking to end the week marginally lower. Although the cautious market mood helps XAU/USD hold its ground, growing expectations for a less-dovish Fed policy outlook caps the pair's upside.

Bitcoin misses Santa rally even as on-chain metrics show signs of price recovery
Bitcoin (BTC) price hovers around $97,000 on Friday, erasing most of the gains from earlier this week, as the largest cryptocurrency missed the so-called Santa Claus rally, the increase in prices prior to and immediately following Christmas Day.

2025 outlook: What is next for developed economies and currencies?
As the door closes in 2024, and while the year feels like it has passed in the blink of an eye, a lot has happened. If I had to summarise it all in four words, it would be: ‘a year of surprises’.

Best Forex Brokers with Low Spreads
VERIFIED Low spreads are crucial for reducing trading costs. Explore top Forex brokers offering competitive spreads and high leverage. Compare options for EUR/USD, GBP/USD, USD/JPY, and Gold.
