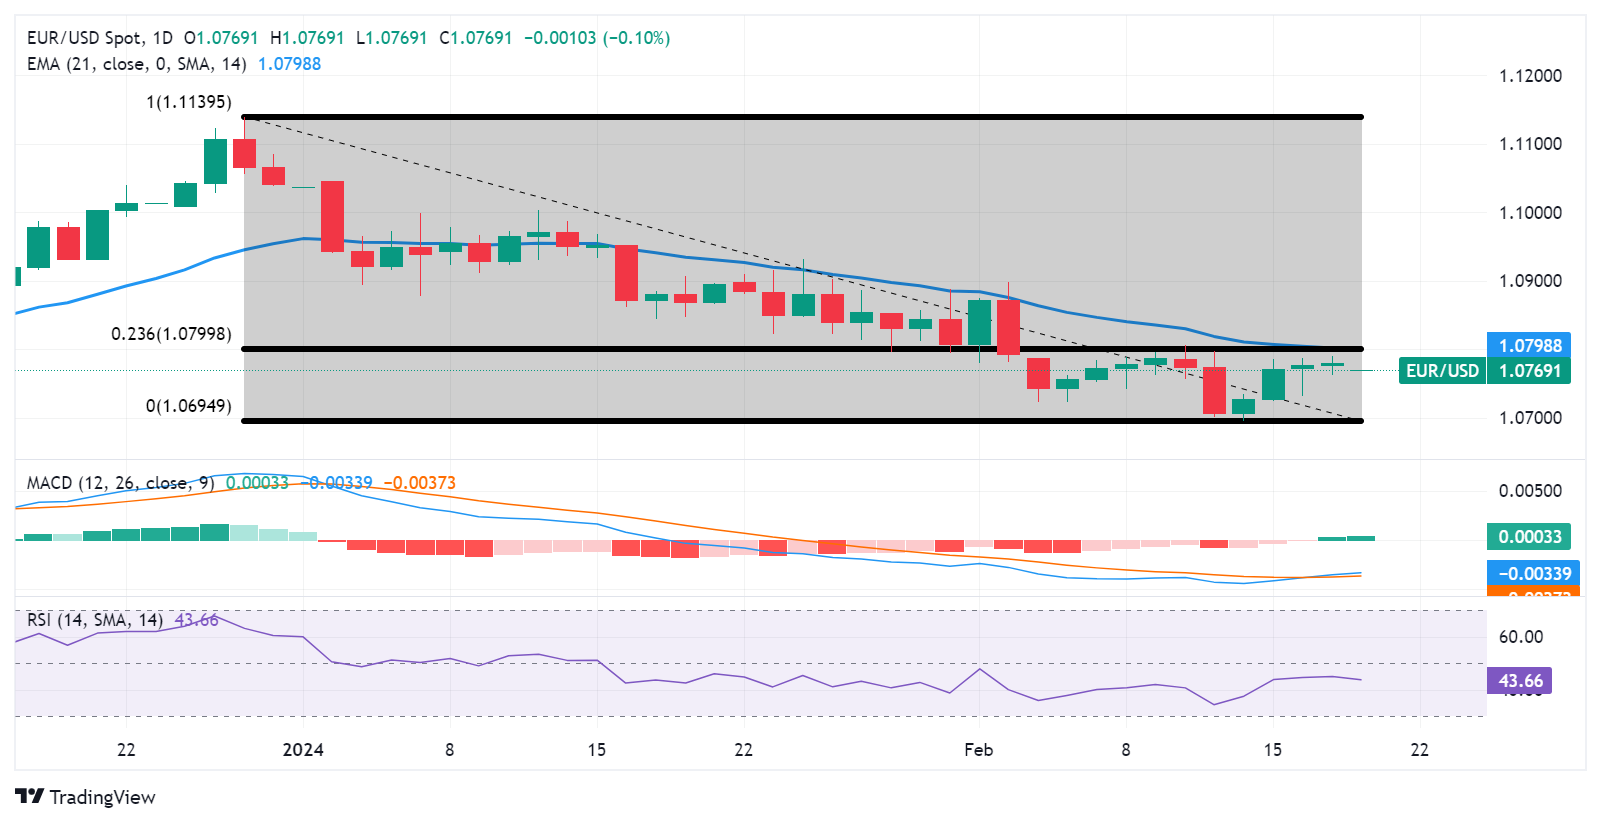
- EUR/USD could approach the major support at 1.0750 following February’s low at 1.0694.
- The resistance zone could be found around the 21-day EMA at 1.0798 and the 23.6% Fibonacci retracement at 1.0799.
- Traders may await the lagging indicator MACD to confirm a directional trend.
EUR/USD retreats from the weekly high of 1.0789, which was recorded on Monday, snapping a four-day winning streak. The pair trades lower around 1.0770 during the Asian hours on Tuesday with positioning above the immediate support at the psychological level of 1.0750.
A break below the latter could put weight on the EUR/USD pair to navigate the further support region around the psychological level of 1.0700, in conjunction with February’s low at 1.0694, which was observed on February 14.
The EUR/USD pair could find the key resistance zone around the 21-day Exponential Moving Average (EMA) at 1.0798 lined up with the 23.6% Fibonacci retracement at 1.0799 and the psychological level of 1.0800.
A firm breakthrough above the resistance zone could exert upward support on the EUR/USD pair to explore the further major barrier at 1.0850, to revisit February’s high at 1.0897 aligned with the psychological level of 1.0900.
The technical analysis of the EUR/USD pair suggests a mixed outlook in the market. The 14-day Relative Strength Index (RSI) is below the 50 mark, indicating a bearish momentum. However, the lagging indicator Moving Average Convergence Divergence (MACD), although still below the centerline, is above the signal line, suggesting a tepid momentum in the market.
Given these conflicting signals, market participants may choose to await further confirmation from the MACD indicator on the directional trend for the EUR/USD pair.
EUR/USD: Daily Chart
Information on these pages contains forward-looking statements that involve risks and uncertainties. Markets and instruments profiled on this page are for informational purposes only and should not in any way come across as a recommendation to buy or sell in these assets. You should do your own thorough research before making any investment decisions. FXStreet does not in any way guarantee that this information is free from mistakes, errors, or material misstatements. It also does not guarantee that this information is of a timely nature. Investing in Open Markets involves a great deal of risk, including the loss of all or a portion of your investment, as well as emotional distress. All risks, losses and costs associated with investing, including total loss of principal, are your responsibility. The views and opinions expressed in this article are those of the authors and do not necessarily reflect the official policy or position of FXStreet nor its advertisers. The author will not be held responsible for information that is found at the end of links posted on this page.
If not otherwise explicitly mentioned in the body of the article, at the time of writing, the author has no position in any stock mentioned in this article and no business relationship with any company mentioned. The author has not received compensation for writing this article, other than from FXStreet.
FXStreet and the author do not provide personalized recommendations. The author makes no representations as to the accuracy, completeness, or suitability of this information. FXStreet and the author will not be liable for any errors, omissions or any losses, injuries or damages arising from this information and its display or use. Errors and omissions excepted.
The author and FXStreet are not registered investment advisors and nothing in this article is intended to be investment advice.


Recommended content
Editors’ Picks

EUR/USD drops below 1.1400 after US PMI data
EUR/USD comes under renewed bearish pressure in the American session and trades below 1.1400. Upbeat PMI data from the US and a Wall Street Journal report claiming that the White House is considering slashing tariffs on Chinese imports support the USD and weigh on the pair.

GBP/USD retreats below 1.3300 as USD rebounds
GBP/USD stays under bearish pressure and trades below 1.3300 on Wednesday. The US Dollar benefits from the upbeat PMI data and easing fears over a further escalation in the US-China trade conflict, causing the pair to push lower.

Gold slumps below $3,300 on signs of de-escalation of US-China trade conflict
Gold extends its decline and trades below $3,300 in the second half of the day on Wednesday. The Wall Street Journal reported that the Trump administration was considering to lower tariffs on Chinese goods, reviving optimism about a de-escalation in the trade war and causing Gold to lose interest as a safe-haven.

Bitcoin bullish momentum builds as premium exceeds 9% for first time in three months
Bitcoin price is extending its gains, trading above $94,000 at the time of writing on Wednesday, following a two-day rally of 9.75% so far this week. BTC rally gathers momentum as trade war fears ease, following US President Donald Trump’s downplaying of tensions with China.

Five fundamentals for the week: Traders confront the trade war, important surveys, key Fed speech Premium
Will the US strike a trade deal with Japan? That would be positive progress. However, recent developments are not that positive, and there's only one certainty: headlines will dominate markets. Fresh US economic data is also of interest.

The Best brokers to trade EUR/USD
SPONSORED Discover the top brokers for trading EUR/USD in 2025. Our list features brokers with competitive spreads, fast execution, and powerful platforms. Whether you're a beginner or an expert, find the right partner to navigate the dynamic Forex market.