|

EUR/USD Price Analysis: Renewed 20-day SMA rejection curbs bullish attempts

  • EUR/USD dips and lands around 1.0285 amid fading upside impetus.
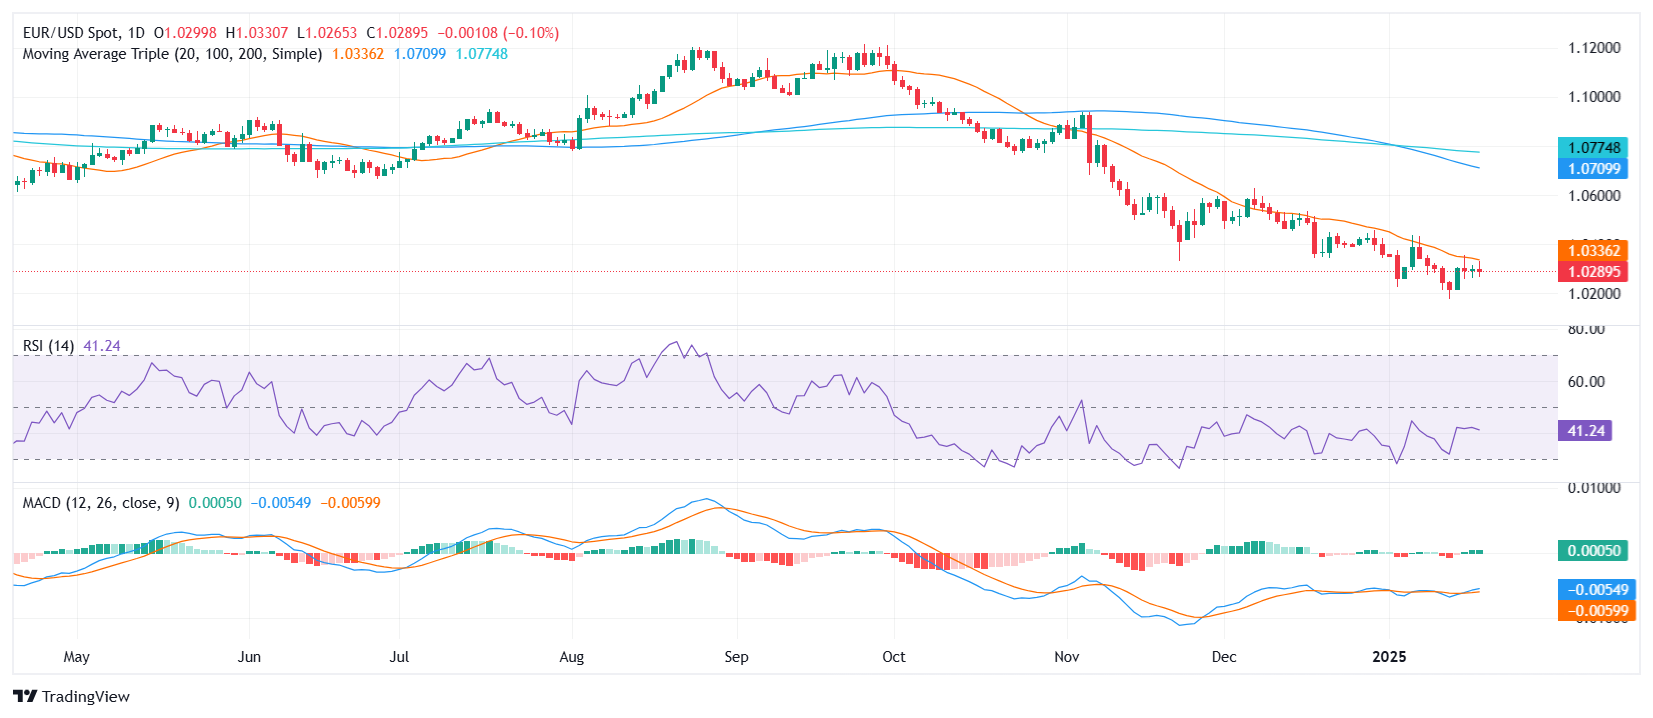
  • RSI edges up, still confined in negative territory and signaling lukewarm buying interest.
  • MACD histogram remains flat with green bars, highlighting a lack of compelling bullish follow-through.

The EUR/USD pair struggled to maintain upward momentum on Friday, slipping by 0.20% to settle around the 1.0285 mark. Efforts to break decisively above the 20-day Simple Moving Average (SMA) once again fell short, underscoring persistent headwinds facing any near-term recovery. While the pair has managed to avoid a more pronounced sell-off, the market’s appetite for stronger gains appears muted. On the technical front, the Relative Strength Index (RSI) has nudged mildly higher to 44, a level that still suggests lingering bearish undertones. Meanwhile, the Moving Average Convergence Divergence (MACD) histogram continues to print flat green bars, indicating that buyers have yet to fully step in to reverse the pair’s recent rejection from overhead resistance.

Looking ahead, the 20-day SMA, situated around 1.0330, remains a pivotal hurdle for EUR/USD. A convincing move above this threshold would be needed to shift the short-term outlook in favor of the bulls. Failing that, further downside risks may emerge, with the next layer of support likely clustered near 1.0260–1.0250.

EUR/USD daily chart

Author

Patricio Martín

Patricio is an economist from Argentina passionate about global finance and understanding the daily movements of the markets.

More from Patricio Martín
Share:

Editor's Picks

EUR/USD keeps the offered stance just above 1.1700

EUR/USD is coming under heavy selling pressure in what has been a rather grim start to the new trading week, with the pair now trading close to the 1.1700 support area as the US Dollar stages a solid rebound. The prevailing flight to safety mood continues to favour the Greenback, as investors react to the escalating conflict in the Middle East and trim risk exposure across the board.

GBP/USD hits new yearly lows near 1.3300

GBP/USD adds to the recent bearish tone, approaching to the key 1.3300 support to reach fresh YTD troughs against the backdrop of the robust performance of the US Dollar. Indeed, Cable’s decline comes amid the firm demand for the safe-haven space in the wake of the US and Israel attacks to Iran.

Gold trims losses, back below $5,400

Gold now surrenders part of the earlier advance past the $5,400 mark per troy ounce at the beginning of the week. Indeed, the precious metal’s strong uptick remains fuelled by increasing geopolitical tensions in the Middle East amid the intense demand for safer assets.

Bitcoin on brink of breakdown amid US-Iran war

Bitcoin (BTC) remains under pressure near the key support level of $65,700. Trading at $66,400 at the time of writing on Monday, a breakdown below this critical level would suggest a deeper correction ahead.

The Fed is finally talking about AI – Here's why it matters for the US Dollar

AI is moving from earnings calls into the heart of monetary policy discussions, forcing Federal Reserve officials to confront a new question: How to act if AI reshapes inflation, employment and interest rates at the same time?

Grass 20% bullish breakout defies broader market weakness

Grass (GRASS) is edging up above $0.30 at the time of writing on Monday. The token’s notable 20% intraday surge stands out amid heightened volatility in the broader crypto market.