|

EUR/USD Price Analysis: Rebounds from over one-week low, moves back above mid-1.0900s

  • EUR/USD regains positive traction on Wednesday and snaps a three-day losing streak.
  • A modest USD downtick lends support ahead of the US macro data and FOMC minutes.
  • A convincing break below the 50% Fibo. might shift the bias in favour of bearish traders.

The EUR/USD pair attracts some buying during the Asian session on Wednesday and for now, seems to have snapped a three-day losing streak to over a one-week low touched the previous day. Spot prices currently trade around the 1.0960 region, up just over 0.15% for the day, and remain at the mercy of the US Dollar (USD) price dynamics.

The USD Index (DXY), which tracks the Greenback against a basket of currencies, erodes a part of Tuesday's strong gains amid some repositioning trade ahead of important US macro data and the crucial FOMC meeting minutes. In the meantime, doubts over early rate cuts by the Federal Reserve (Fed) might hold back traders from placing aggressive bearish bets around the buck and keep a lid on any further gains for the EUR/USD pair.

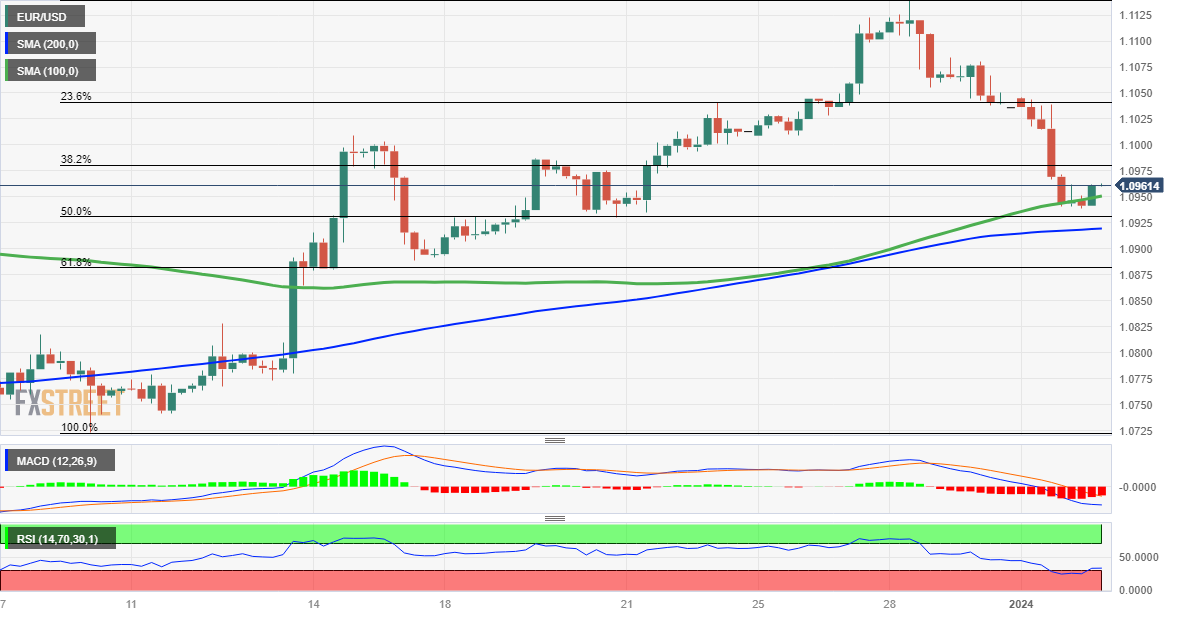
From a technical perspective, spot prices showed some resilience below the 100-period Simple Moving Average (SMA) on the 4-hour chart and found decent support near the 50% Fibonacci retracement level of the December 11-28 rally. The latter is pegged near the 1.0940 area and should now act as a key pivotal point, which if broken should pave the way for an extension of the pullback from the 1.1135-1.1140 area, or a five-month peak touched last week.

The EUR/USD pair might then weaken below the 200-period SMA on the 4-hour chart, currently around the 1.0920 region, and the 1.0900 mark, towards testing the 61.8% Fibo. level, around the 1.0885-1.0880 zone. Some follow-through selling will be seen as a fresh trigger for bearish traders and drag spot prices further towards the 1.0835-1.0830 intermediate support en route to the 1.0800 round-figure mark and the 1.0765-1.0760 region.

Meanwhile, oscillators on the daily chart – though have been losing traction – are still holding in the positive territory and favour bullish traders. That said, any further intraday move-up is likely to confront some resistance near the 1.0980 area. This is closely followed by the 1.1000 psychological mark, above which the EUR/USD pair could climb to the 1.1040-1.1045 region en route to the 1.1080-1.1085 zone before aiming to reclaim the 1.1100 round figure.

EUR/USD 4-hour chart

fxsoriginal

Technical levels to watch

EUR/USD

Overview
Today last price1.096
Today Daily Change0.0017
Today Daily Change %0.16
Today daily open1.0943
 
Trends
Daily SMA201.0937
Daily SMA501.0842
Daily SMA1001.076
Daily SMA2001.0846
 
Levels
Previous Daily High1.1046
Previous Daily Low1.0941
Previous Weekly High1.114
Previous Weekly Low1.1009
Previous Monthly High1.114
Previous Monthly Low1.0724
Daily Fibonacci 38.2%1.0981
Daily Fibonacci 61.8%1.1006
Daily Pivot Point S11.0907
Daily Pivot Point S21.0872
Daily Pivot Point S31.0802
Daily Pivot Point R11.1012
Daily Pivot Point R21.1082
Daily Pivot Point R31.1117

Author

Haresh Menghani

Haresh Menghani is a detail-oriented professional with 10+ years of extensive experience in analysing the global financial markets.

More from Haresh Menghani
Share:

Editor's Picks

EUR/USD slumps below 1.1750 as USD benefits from risk-aversion

EUR/USD comes under renewed bearish pressure in the European session and trades below 1.1750 following a recovery attempt earlier in the day. The US Dollar gathers strength and weighs on the pair as investors seek refuge in the wake of Israel and the United States' joint attack on Iran.

GBP/USD targets 1.3500 barrier near moving averages

GBP/USD rebounds from the daily losses, trading around 1.3450 during the Asian hours on Monday. The technical analysis of the daily chart indicates an ongoing bearish bias, as the pair trades within a descending channel pattern.

Gold surges on safe-haven demand, rises above $5,400

Gold benefits from intense risk-aversion on Monday and climbs above $5,400, setting a fresh monthly-high in the process. Tensions in the Middle East remain high as Israel and Hezbollah continue to exchange strikes following the US-Israel joint attack on Iran over the weekend.

Bitcoin, Ethereum and Ripple under pressure as key supports face breakdown risk

Bitcoin, Ethereum, and Ripple prices trade on the back foot at the start of this week on Monday, after extending losses in the previous week. BTC is on the brink of a breakdown, ETH is capped below key resistance, and XRP risks a crack of the trendline.

The market is paying for insurance, not apocalypse

As expected, this morning felt less like a Monday market open and more like a fire drill. Futures screens flickered red. S&P contracts down almost 1%. Nasdaq off 1.2%. Brent leaped 13% through $80. Gold rose 1.6% toward $5350 before paring some gains. The dollar is strutting mildly. The Swiss franc is quietly doing what it always does in a storm, catching some safe-haven flows.

Pi Network Price Forecast: Core team offloads supply, weighing on PI recovery

Pi Network  hovers below $0.1700, broadly steady at press time on Monday, attempting a recovery after a 2% loss the previous day. Sunday’s decline aligned with nearly 49 million PI tokens offloaded by the Pi Foundation, implying a spike in supply pressure that capped the prevailing four-day recovery.