|

EUR/USD Price Analysis: Hovers below 1.0700, eyeing the 1.0600 figure amid bearish signals

  • EUR/USD trades at 1.0696, up 0.01%, but remains below the pivotal 1.0700 mark, signaling potential for further downside.
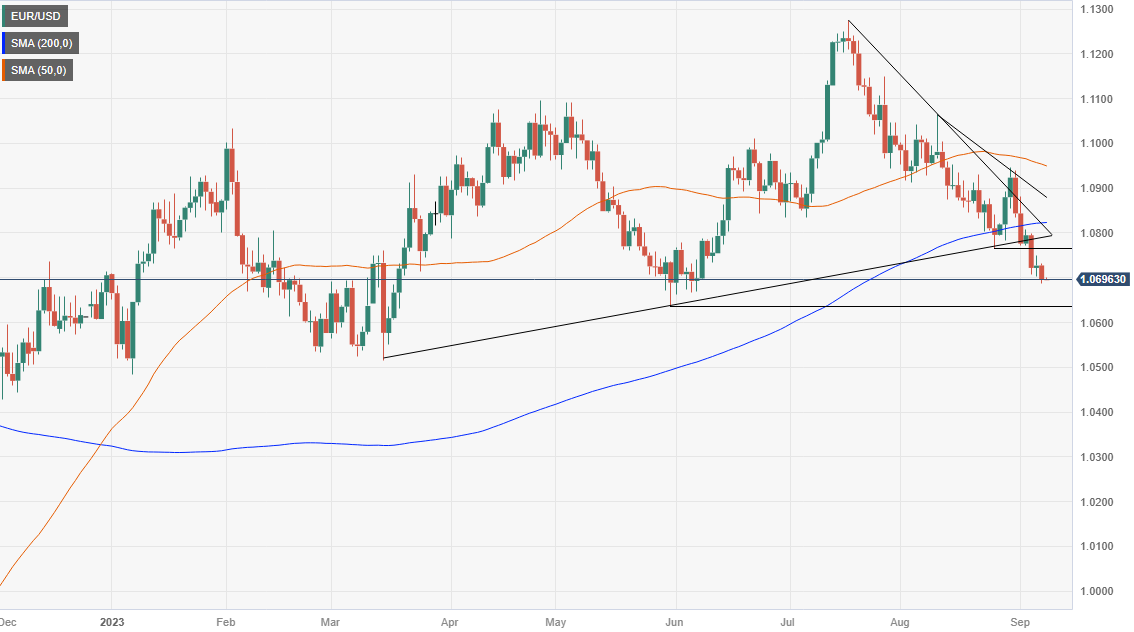
  • For a bullish reversal, the pair needs to clear 1.0700 and aim for September 6 daily high of 1.0748 as an intermediate resistance.
  • Most likely scenario sees EUR/USD targeting May 31 low of 1.0635, with a breach potentially exposing the 1.0600 psychological level.

The EUR/USD begins the Asian session almost flat but below the 1.0700 figure, seen as a bearish signal, after printing losses of 0.29% on Thursday, which could open the door to test May lows. At the time of writing, the major trades at 1.0696, up 0.01%.

EUR/USD Price Analysis: Technical outlook

The daily chart portrays a continuation of the downtrend, as the pair achieved a new lower-low and trades near the bottom of the weekly range. However, being the 1.0700 figure that usually keeps the EUR/USD seesawing in the top/bottom of the double zero mark, buyers and sellers need to take action to win the battle.

For buyers, the EUR/USD must climb above 1.0700 and reclaim the September 6 daily high of 1.0748, an intermediate resistance level. Once cleared, the pair's next ceiling level would be the September 5 high at 1.0798 before challenging the 200-day Moving Average (DMA) at 1.0822.

On the flip side, and the most likely scenario, due to recent economic data and the EUR/USD breaking decisively below the 200-DMA, the first support would be the May 31 daily low of 1.0635. A breach of the latter will expose the psychological 1.0600 figure, followed by the March 15 swing low of 1.0516.

EUR/USD Price Action – Daily chart

EUR/USD

EUR/USD

Overview
Today last price1.0696
Today Daily Change-0.0031
Today Daily Change %-0.29
Today daily open1.0727
 
Trends
Daily SMA201.0853
Daily SMA501.0957
Daily SMA1001.0916
Daily SMA2001.0822
 
Levels
Previous Daily High1.0749
Previous Daily Low1.0703
Previous Weekly High1.0946
Previous Weekly Low1.0772
Previous Monthly High1.1065
Previous Monthly Low1.0766
Daily Fibonacci 38.2%1.0731
Daily Fibonacci 61.8%1.072
Daily Pivot Point S11.0704
Daily Pivot Point S21.068
Daily Pivot Point S31.0657
Daily Pivot Point R11.075
Daily Pivot Point R21.0772
Daily Pivot Point R31.0796

Author

Christian Borjon Valencia

Christian Borjon began his career as a retail trader in 2010, mainly focused on technical analysis and strategies around it. He started as a swing trader, as he used to work in another industry unrelated to the financial markets.

More from Christian Borjon Valencia
Share:

Markets move fast. We move first.

Orange Juice Newsletter brings you expert driven insights - not headlines. Every day on your inbox.

By subscribing you agree to our Terms and conditions.

Editor's Picks

EUR/USD eases toward 1.1700 as USD finds fresh demand

EUR/USD eases toward the 1.1700 mark in Europe trading on Friday. The pair faces headwinds from a renewed uptick in the US Dollar as investors look past softer US inflation data. However, the EUR/USD downside appears capped by expectations of the Fed-ECB monetary policy divergence. 

GBP/USD steadies below 1.3400 as traders digest BoE policy update and US inflation data

The GBP/USD pair stalls the previous day's pullback from the vicinity of mid-1.3400s and a nearly two-month high, though it struggles to attract meaningful buyers during the Asian session on Friday. Spot prices currently trade around the 1.3380-1.3385 region, up only 0.05% for the day, amid mixed cues.

Gold stays weak below $4,350 as USD bulls shrug off softer US CPI

Gold holds the previous day's late pullback from the vicinity of the record high and stays in the red below $4,350 in the European session on Friday. The US CPI report released on Thursday pointed to cooling inflationary pressures, but the US Dollar seems resilient amid a fresh bout of short-covering.

Bitcoin, Ethereum and Ripple correction slide as BoJ rate decision weighs on sentiment

Bitcoin, Ethereum, and Ripple are extending their correction phases after losing nearly 3%, 8%, and 10%, respectively, through Friday. The pullback phase is further strengthened as the upcoming Bank of Japan’s rate decision on Friday weighs on risk sentiment, with BTC breaking key support, ETH deepening weekly losses, and XRP sliding to multi-month lows.

How much can one month of soft inflation change the Fed’s mind?

One month of softer inflation data is rarely enough to shift Federal Reserve policy on its own, but in a market highly sensitive to every data point, even a single reading can reshape expectations. November’s inflation report offered a welcome sign of cooling price pressures. 

Ethereum Price Forecast: EF outlines ways to solve growing state issues

Ethereum price today: $2,920. The EF noted that Ethereum's growing state could lead to centralization and weaken censorship resistance. The Stateless Consensus team outlined state expiry, state archive and partial statelessness as potential solutions to the growing state load.