|

EUR/USD Price Analysis: Falls to near 1.0700 before a throwback support

  • The EUR/USD pair could test a throwback support at the 1.0670 level.
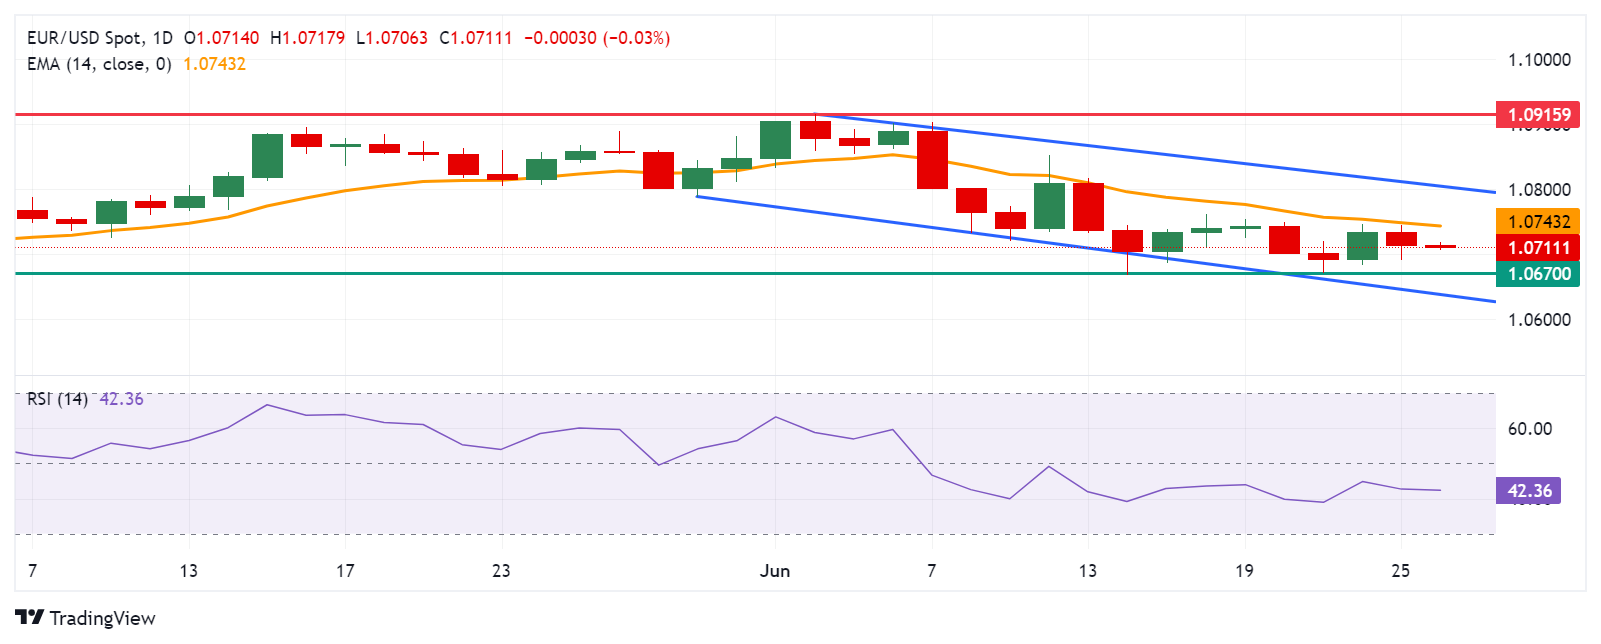
  • The daily chart suggests a bearish bias as the pair consolidates within a descending channel.
  • The immediate resistance appears at the 14-day EMA at the level of 1.0743.

EUR/USD extends its losses for the second consecutive day, trading around 1.0710 during the Asian session on Wednesday. A technical analysis of the daily chart suggests a bearish bias for the pair, as it consolidates within the descending channel.

Additionally, the 14-day Relative Strength Index (RSI) momentum indicator is positioned below the 50 level, suggesting a confirmation of a bearish bias for the EUR/USD pair.

The EUR/USD pair could find immediate support at the psychological level of 1.0700. A break below this level could exert downward pressure on the pair to test the throwback support at the level of 1.0670.

Further decline would strengthen the bearish bias, and the pair could navigate the region around the lower boundary of the descending channel near the 1.0640 level.

On the upside, the EUR/USD pair could meet the immediate barrier at the 14-day Exponential Moving Average (EMA) at 1.0743. A breakthrough above this level could lead the pair to test the area around the psychological level of 1.0800 and the upper boundary of the descending channel nearing the level of 1.0810.

Further resistance appears at the vicinity of the significant level of 1.0900 and a three-month high at 1.0915, which was recorded on June 4.

EUR/USD: Daily Chart

EUR/USD

Overview
Today last price1.071
Today Daily Change-0.0004
Today Daily Change %-0.04
Today daily open1.0714
 
Trends
Daily SMA201.0782
Daily SMA501.0773
Daily SMA1001.0795
Daily SMA2001.079
 
Levels
Previous Daily High1.0744
Previous Daily Low1.0691
Previous Weekly High1.0762
Previous Weekly Low1.0671
Previous Monthly High1.0895
Previous Monthly Low1.065
Daily Fibonacci 38.2%1.0711
Daily Fibonacci 61.8%1.0724
Daily Pivot Point S11.0688
Daily Pivot Point S21.0663
Daily Pivot Point S31.0635
Daily Pivot Point R11.0742
Daily Pivot Point R21.077
Daily Pivot Point R31.0795

Author

Akhtar Faruqui

Akhtar Faruqui is a Forex Analyst based in New Delhi, India. With a keen eye for market trends and a passion for dissecting complex financial dynamics, he is dedicated to delivering accurate and insightful Forex news and analysis.

More from Akhtar Faruqui
Share:

Editor's Picks

EUR/USD stays weak above 1.1750 ahead of German/ EU PMI data

EUR/USD remains on the back foot above 1.1850 in the European session on Friday, well within striking distance of a nearly one-month low set the previous day. Unabated US Dollar demand and nervousness ahead of the German and Eurozone business PMI data keep the pair undermined. 

GBP/USD recovers above 1.3450 after strong UK Retail Sales data

GBP/USD is recovering ground above 1.3450 in European trading on Friday, helped by a modest uptick in the Pound Sterling after a bigger-than-expected increase in the UK Retail Sales for January. However, the further upside appears limited in the pair amid persistent US Dollar strength and ahead of key UK and US data. 

Gold rises for third day on geopolitical risks, US data eyed

Gold gains some positive traction for the third consecutive day on Friday. The upside potential, however, seems limited amid the mixed fundamental backdrop. Moreover, traders might opt to wait for the key US macro releases – the Advance Q4 GDP report and the Personal Consumption Expenditures (PCE) Price Index – before placing fresh directional bets.

Bitcoin, Ethereum and Ripple remain range-bound as breakdown risks rise

Bitcoin, Ethereum, and Ripple are trading sideways within consolidation ranges on Friday, signaling a lack of directional bias in the broader crypto market. BTC rebounded from key support, and ETH is nearing the lower consolidation boundary, while XRP is holding at its lower trendline boundary. 

Hawkish Fed minutes and a market finding its footing

It was green across the board for US Stock market indexes at the close on Wednesday, with most S&P 500 names ending higher, adding 38 points (0.6%) to 6,881 overall. At the GICS sector level, energy led gains, followed by technology and consumer discretionary, while utilities and real estate posted the largest losses.

Official Trump price approaches breakout with mixed signals from traders

Official Trump (TRUMP) is trading at $3.50 at the time of writing, approaching its upper consolidation range. A breakout from this range could open the door for an upside move. On-chain data shows market indecision, with balanced flows between bulls and bears, signaling a lack of clear directional bias.