|

EUR/USD Price Analysis: Extends pullback from 200-HMA towards weekly support line

  • EUR/USD remains sidelined after stepping back from the key HMA resistance.
  • Sluggish MACD, steady RSI also favors the continuation of recent weakness.
  • Weekly support line holds the gate for further downside targeting 2022 low.
  • 61.8% Fibonacci retracement level adds to the upside filters.

EUR/USD treads water around 1.0940 amid Tuesday’s initial Asian session, after a positive start to the week.

Even so, the major currency pair holds onto the previous day’s pullback from the 200-HMA, which in turn joins downbeat MACD and steady RSI to suggest the quote’s further grinding towards the south.

That said, an upward sloping trend line from March 07 will join the 23.6% Fibonacci retracement (Fibo.) of February 25 to March 07 downside to restrict short-term downside near 1.0915.

In a case where EUR/USD drops below 1.0915, the 1.0900 threshold may act as an intermediate halt ahead of directing the quote to the recent multi-month low of 1.0806.

Alternatively, recovery moves need to cross the 200-HMA level of 1.0975 to gain the market’s attention.

Following that, the 1.1000 round figure and the 61.8% Fibo. near 1.1095 will lure the EUR/USD bulls.

It’s worth noting, however, that a clear run-up beyond 1.1095 will help buyers to challenge the monthly high around 1.1235.

EUR/USD: Hourly chart
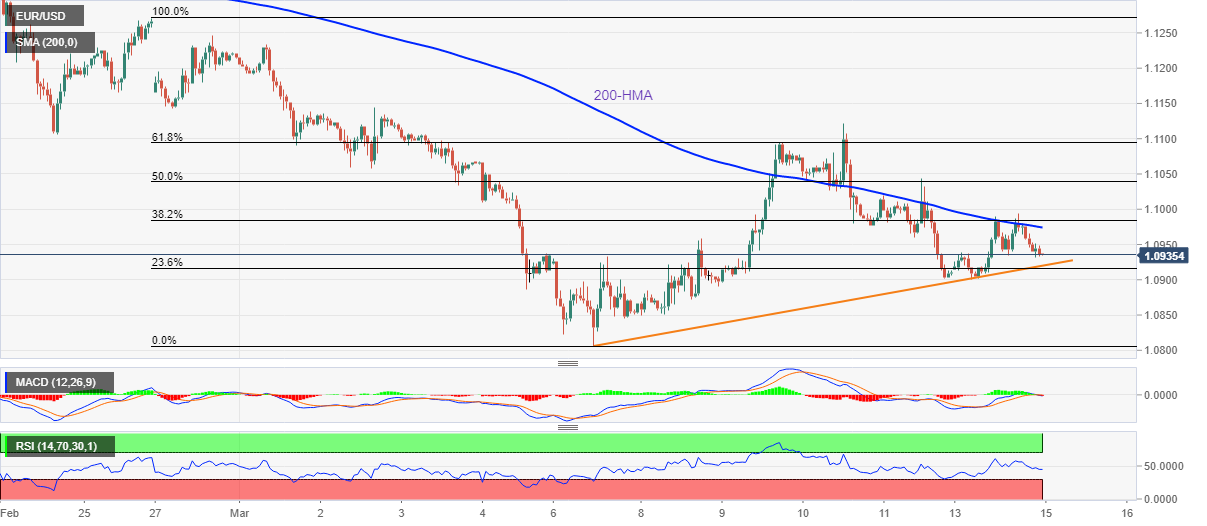
Trend: Bearish

Additional important levels 

Overview
Today last price1.0936
Today Daily Change0.0025
Today Daily Change %0.23%
Today daily open1.0911
 
Trends
Daily SMA201.1167
Daily SMA501.127
Daily SMA1001.1326
Daily SMA2001.1561
 
Levels
Previous Daily High1.1044
Previous Daily Low1.0902
Previous Weekly High1.1121
Previous Weekly Low1.0806
Previous Monthly High1.1495
Previous Monthly Low1.1106
Daily Fibonacci 38.2%1.0956
Daily Fibonacci 61.8%1.099
Daily Pivot Point S11.0861
Daily Pivot Point S21.0811
Daily Pivot Point S31.0719
Daily Pivot Point R11.1002
Daily Pivot Point R21.1094
Daily Pivot Point R31.1144

Author

Anil Panchal

Anil Panchal

FXStreet

Anil Panchal has nearly 15 years of experience in tracking financial markets. With a keen interest in macroeconomics, Anil aptly tracks global news/updates and stays well-informed about the global financial moves and their implications.

More from Anil Panchal
Share:

Editor's Picks

EUR/USD holds firm above 1.1900 as US NFP looms

EUR/USD holds its upbeat momentum above 1.1900 in the European trading hours on Wednesday, helped by a broadly weaker US Dollar. Markets could turn cautious later in the day as the delayed US employment report for January will takes center stage. 

GBP/USD remains above nine-day EMA near 1.3650

GBP/USD recovers its recent losses from the previous session, trading around 1.3680 during the European hours on Wednesday. The technical analysis of the daily chart indicates a sustained bullish bias, as the pair trades within an ascending channel pattern.

Gold sticks to gains near $5,050 as focus shifts to US NFP

Gold holds moderate gains near the $5,050 level in the European session on Wednesday, reversing a part of the previous day's modest losses amid dovish US Federal Reserve-inspired US Dollar weakness. This, in turn, is seen as a key factor acting as a tailwind for the non-yielding yellow metal ahead of the critical US NFP release. 

US Nonfarm Payrolls expected to show modest job gains in January

The United States Bureau of Labor Statistics will release the delayed Nonfarm Payrolls data for January on Wednesday at 13:30 GMT. Investors expect NFP to rise by 70K following the 50K increase recorded in December.

S&P 500 at 7,000 is a valuation test, not a liquidity problem

The rebound from last week’s drawdown never quite shook the sense that it was being supported by borrowed conviction. The S&P 500 once again tested near the 7,000 level (6,986 as the high watermark) and failed, despite a macro backdrop that would normally be interpreted as supportive of risk.

Bitcoin price slips below $67,000 ahead of US Nonfarm Payrolls data

Bitcoin price extends losses, and trades below the lower consolidating boundary at $67,300 at the time of writing. A firm close below this level could trigger a deeper correction for BTC. Despite the weakness in price action, institutional demand shows signs of support, recording mild inflows in ETFs so far this week.