|

EUR/USD Price Analysis: Extends its downside above 1.0550 amid oversold RSI

  • EUR/USD loses traction above the mid-1.0500s; holds below the 50- and 100-hour EMAs. 
  • The oversold RSI condition indicates that further consolidation cannot be ruled out. 
  • The immediate resistance level will emerge at 1.0600; 1.0540 acts as a key support level. 

The EUR/USD pair remains under selling pressure for the seventh consecutive day during the early European session on Wednesday. The pair posts its lowest level since March 16 due to the hawkish stance from the Federal Reserve (Fed) and a sign that the European Central Bank (ECB) could avoid any further rate hikes. The major pair currently trades around 1.0563, losing 0.09% for the day. 

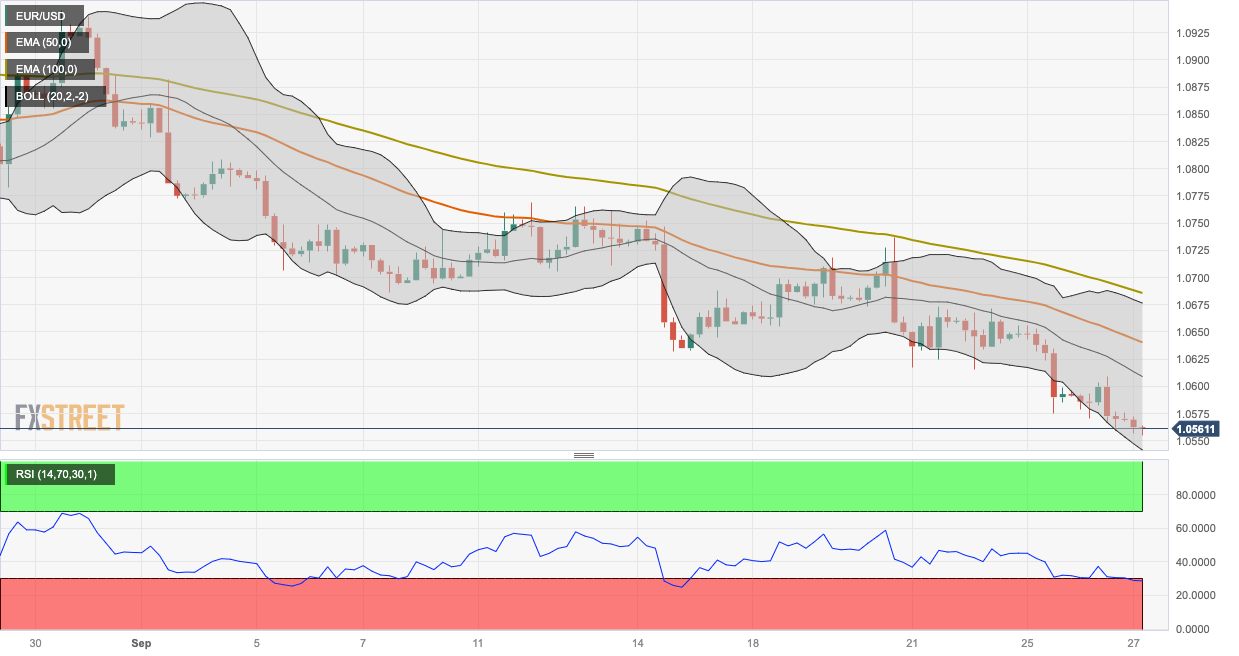
According to the four-hour chart, EUR/USD holds below the 50- and 100-hour Exponential Moving Averages (EMAs) with a downward slope, which means the path of least resistance for the pair is to the downside. The Relative Strength Index (RSI) holds in bearish territory below 50. However, the oversold condition indicates that further consolidation cannot be ruled out before positioning for any near-term EUR/USD depreciation.

That said, the immediate resistance level for EUR/USD will emerge near a psychological round mark at 1.0600. The additional upside filter is located at 1.0640 (50-hour EMA). The critical barrier to watch is the 1.0675-1.0685 region, representing the confluence of the upper boundary of the Bollinger Band and the 100-hour EMA.

On the downside, the lower limit of the Bollinger Band at 1.0540 acts as a key support level for EUR/USD. Further south, the next stop of the major pair is seen at 1.0515 (a low of March 15). Any follow-through selling below the latter would expose the next downside stop at 1.0460 (a low of December 6, 2022)

EUR/USD four-hour chart

EUR/USD

Overview
Today last price1.0563
Today Daily Change-0.0010
Today Daily Change %-0.09
Today daily open1.0573
 
Trends
Daily SMA201.0711
Daily SMA501.0859
Daily SMA1001.0869
Daily SMA2001.083
 
Levels
Previous Daily High1.0609
Previous Daily Low1.0562
Previous Weekly High1.0737
Previous Weekly Low1.0615
Previous Monthly High1.1065
Previous Monthly Low1.0766
Daily Fibonacci 38.2%1.058
Daily Fibonacci 61.8%1.0591
Daily Pivot Point S11.0554
Daily Pivot Point S21.0534
Daily Pivot Point S31.0507
Daily Pivot Point R11.0601
Daily Pivot Point R21.0628
Daily Pivot Point R31.0648

Author

Lallalit Srijandorn

Lallalit Srijandorn is a Parisian at heart. She has lived in France since 2019 and now becomes a digital entrepreneur based in Paris and Bangkok.

More from Lallalit Srijandorn
Share:

Editor's Picks

EUR/USD revisits 1.1780, or daily lows

EUR/USD now comes under further selling pressure, breaking below the 1.1800 support to reach daily troughs on Thursday. The pair’s decline comes in response to a sudden bout of USD strength amid steady geopolitical tensions. Ealier in the day, the ECB’s Lagarde delivered cautious remarks, although the currency remained apathetic.

GBP/USD retreats from tops, approaching 1.3540

GBP/USD partially sets aside Wednesday’s strong advance and recedes to the 1.3540 region on Thursday. Cable’s modest retracement follows the equally acceptable gains in the Greenback, while investors continue to pencil in a potential BoE rate cut in March.

Gold clings to gains just below $5,200, focus on geopolitics

Gold is edging modestly higher on Thursday, adding to Wednesday’s uptick and holding just below the $5,200 mark per troy ounce against the backdrop of modest gains in the US Dollar. In the meantime, attention is turning to the geopolitical scenario following US-Iran nuclear talks.

Stellar: Relief bounce fades as bearish undertone persists

Stellar is trading around $0.16 at the time of writing on Thursday after rebounding more than 8% in the previous day. Derivatives data paints a negative picture as XLM’s short bets hit a monthly high while Open Interest continues to decline.

The one thing everyone is on the lookout for is US action of some sort against Iran

The FX market is minestrone soup these days. It is befuddled by conflicting data, rumors and small stories exaggerated out of proportion, and Trump-generated uncertainty. 

Bitcoin steadies as traders eye US–Iran talks

Bitcoin (BTC) price is stabilizing around $68,000 at the time of writing on Thursday after a 6.2% relief rally the previous day amid a broader downward trend.