|

EUR/USD Price Analysis: Daily chart now leans bearish

  • EUR/USD's daily chart shows a bearish Doji reversal pattern. 
  • The pair risks falling to September lows near 1.1610.

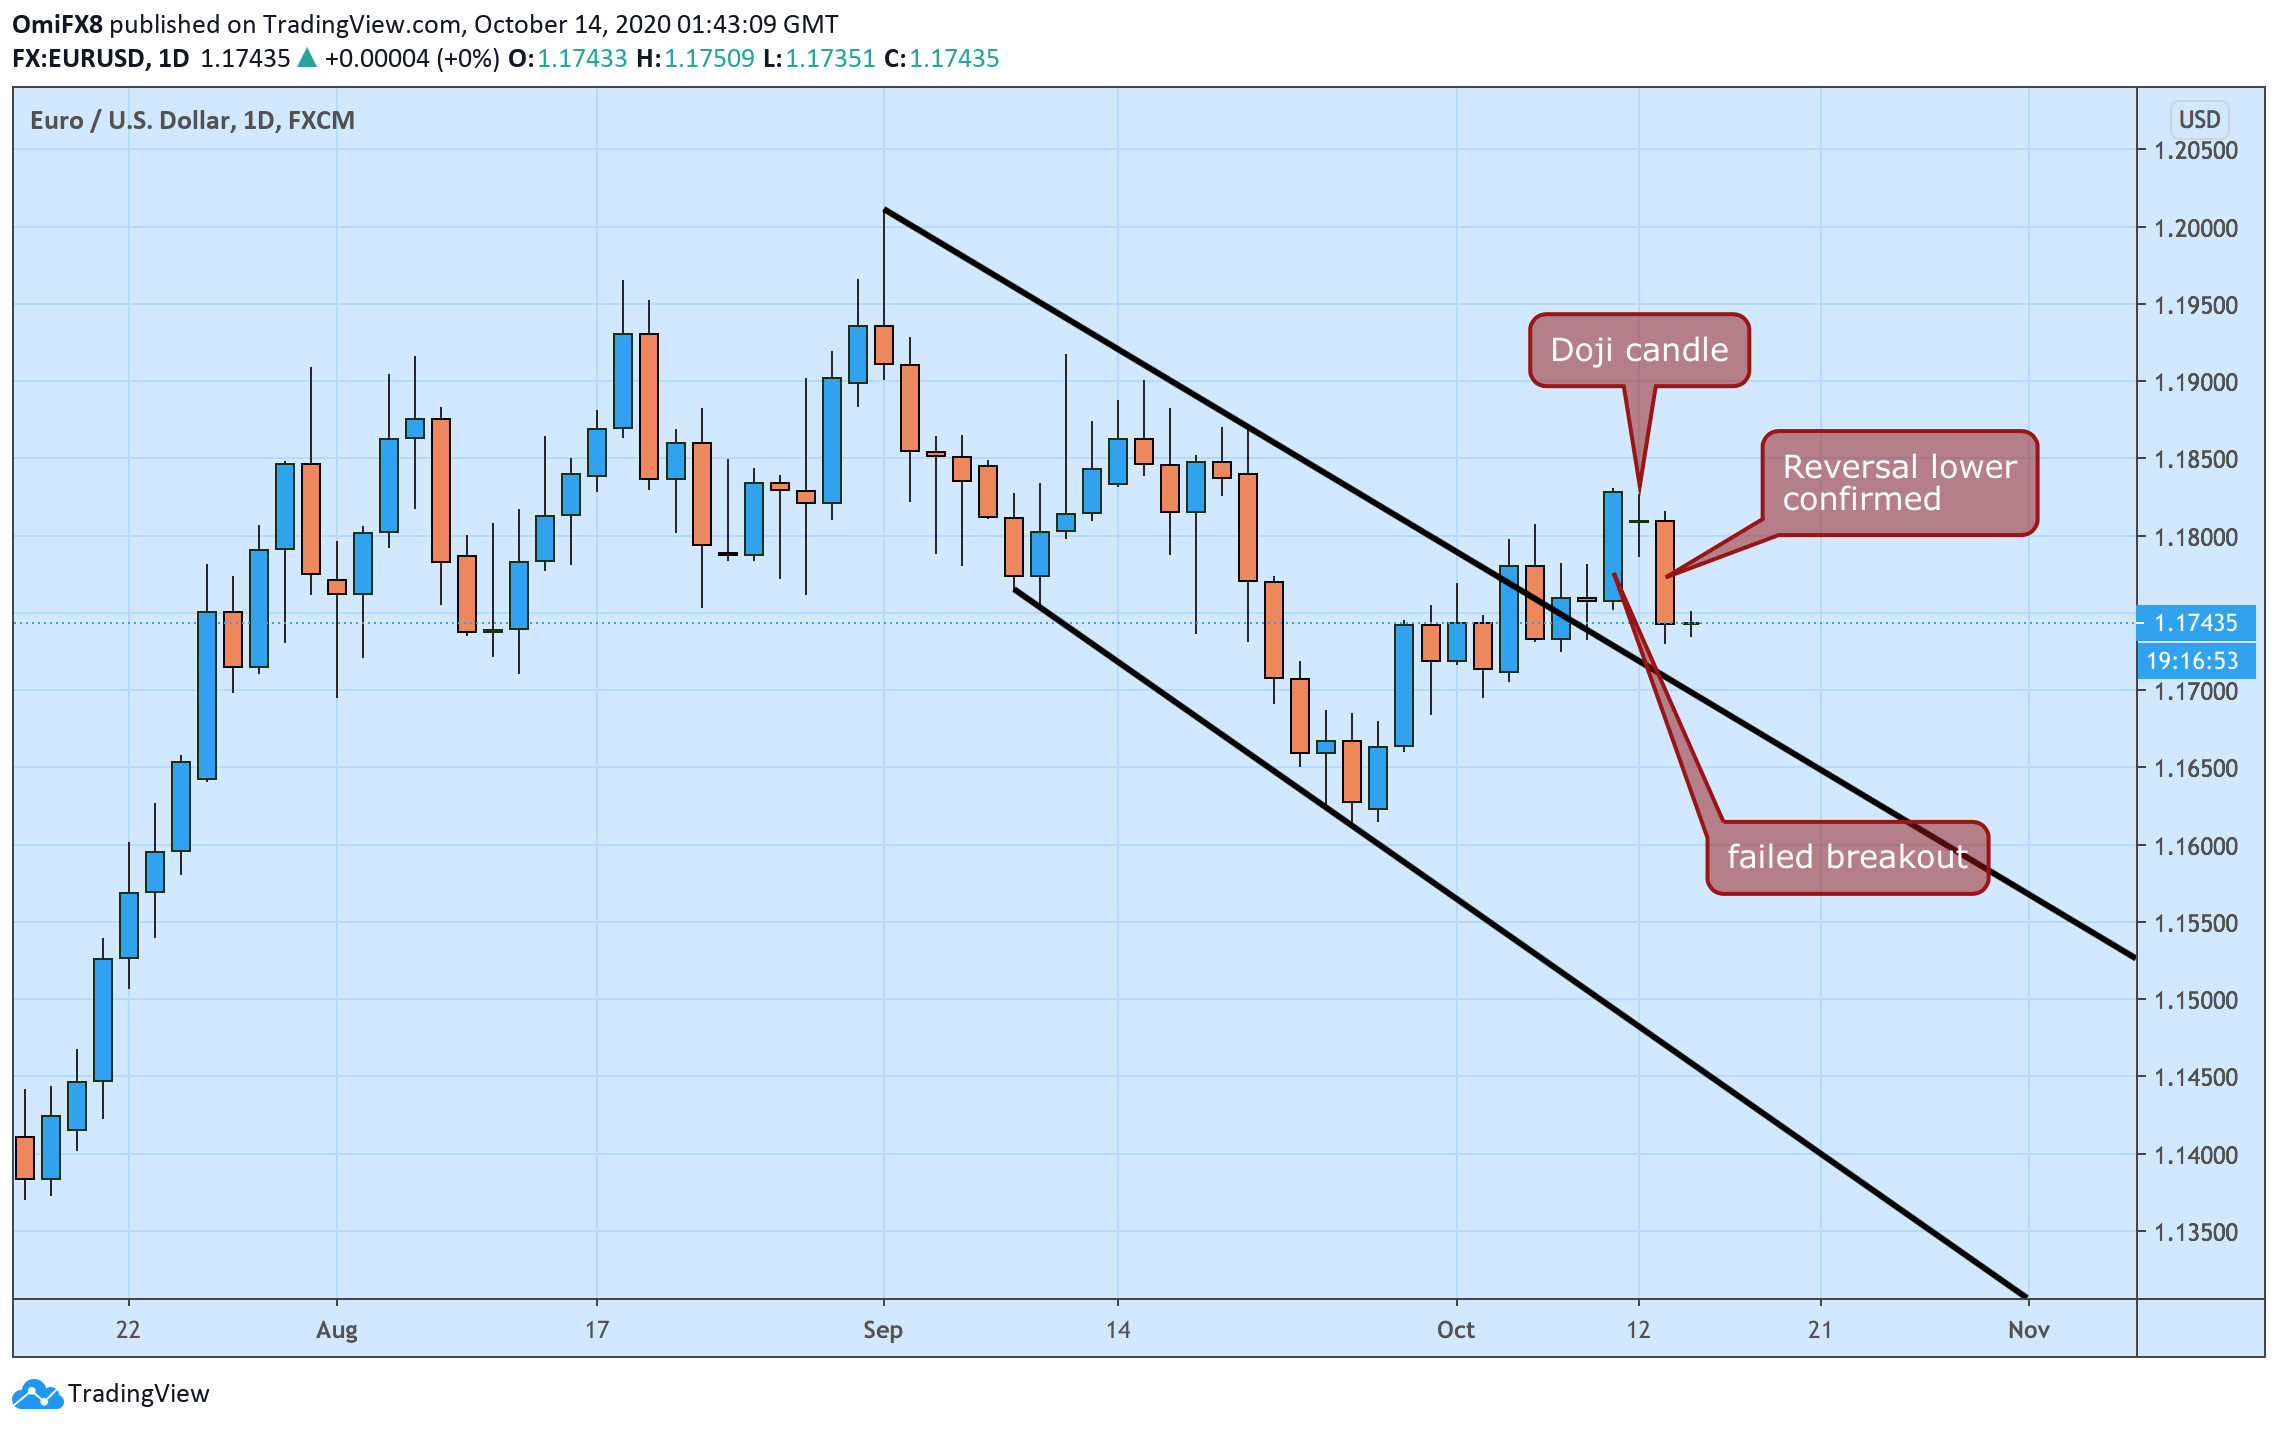
EUR/USD looks south with the daily chart showing a bearish candlestick pattern and a failed breakout. 

Tuesday's 0.57% drop indicates that the indecision period showed by Monday's Doji candle has ended with a bear victory.  In other words, the pair has charted a bearish Doji reversal pattern in the past two days. 

The reversal lower has invalidated a bearish channel breakout confirmed by Friday's bullish marubozu candle. A failed breakout often translates into stronger chart-driven selling. 

As such, EUR/USD could soon revisit the Sept. 25 low of 1.1612. At press time, the pair is sidelined near 1.1742. A close above Friday's high of 1.1831 would revive the bullish outlook

Daily chart

Trend: Bearish

Technical levels

EUR/USD

Overview
Today last price1.174
Today Daily Change-0.0006
Today Daily Change %-0.05
Today daily open1.1746
 
Trends
Daily SMA201.1748
Daily SMA501.1801
Daily SMA1001.1584
Daily SMA2001.1272
 
Levels
Previous Daily High1.1816
Previous Daily Low1.1731
Previous Weekly High1.1831
Previous Weekly Low1.1706
Previous Monthly High1.2011
Previous Monthly Low1.1612
Daily Fibonacci 38.2%1.1763
Daily Fibonacci 61.8%1.1784
Daily Pivot Point S11.1712
Daily Pivot Point S21.1679
Daily Pivot Point S31.1627
Daily Pivot Point R11.1797
Daily Pivot Point R21.1849
Daily Pivot Point R31.1883

Author

Omkar Godbole

Omkar Godbole

FXStreet Contributor

Omkar Godbole, editor and analyst, joined FXStreet after four years as a research analyst at several Indian brokerage companies.

More from Omkar Godbole
Share:

Editor's Picks

EUR/USD meets initial support around 1.1800

EUR/USD remains on the back foot, although it has managed to reverse the initial strong pullback toward the 1.1800 region and regain some balance, hovering around the 1.1850 zone as the NA session draws to a close on Tuesday. Moving forward, market participants will now shift their attention to the release of the FOMC Minutes and US hard data on Wednesday.
 

GBP/USD bounces off lows, retargets 1.3550

After bottoming out just below the 1.3500 yardstick, GBP/USD now gathers some fresh bids and advances to the 1.3530-1.3540 band in the latter part of Tuesday’s session. Cable’s recovery comes as the Greenback surrenders part of its advance, although it keeps the bullish bias well in place for the day.

Gold remains offered below $5,000

Gold stays on the defensive on Tuesday, receding to the sub-$5,000 region per troy ounce on the back of the persistent move higher in the Greenback. The precious metal’s decline is also underpinned by the modest uptick in US Treasury yields across the spectrum.

Ethereum Price Forecast: BitMine extends ETH buying streak, says long-term outlook remains positive

Ethereum (ETH) treasury firm BitMine Immersion continued its weekly purchase of the top altcoin last week after acquiring 45,759 ETH.

UK jobs market weakens, bolstering rate cut hopes

In the UK, the latest jobs report made for difficult reading. Nonetheless, this represents yet another reminder for the Bank of England that they need to act swiftly given the collapse in inflation expected over the coming months. 

Ripple slides to $1.45 as downside risks surge

Ripple edges lower at the time of writing on Tuesday, from the daily open of $1.48, as headwinds persist across the crypto market. A short-term support is emerging at $1.45, but a buildup of bearish positions could further weaken the derivatives market and prolong the correction.