|

EUR/USD Price Analysis: Bulls struggle as key resistance holds firm

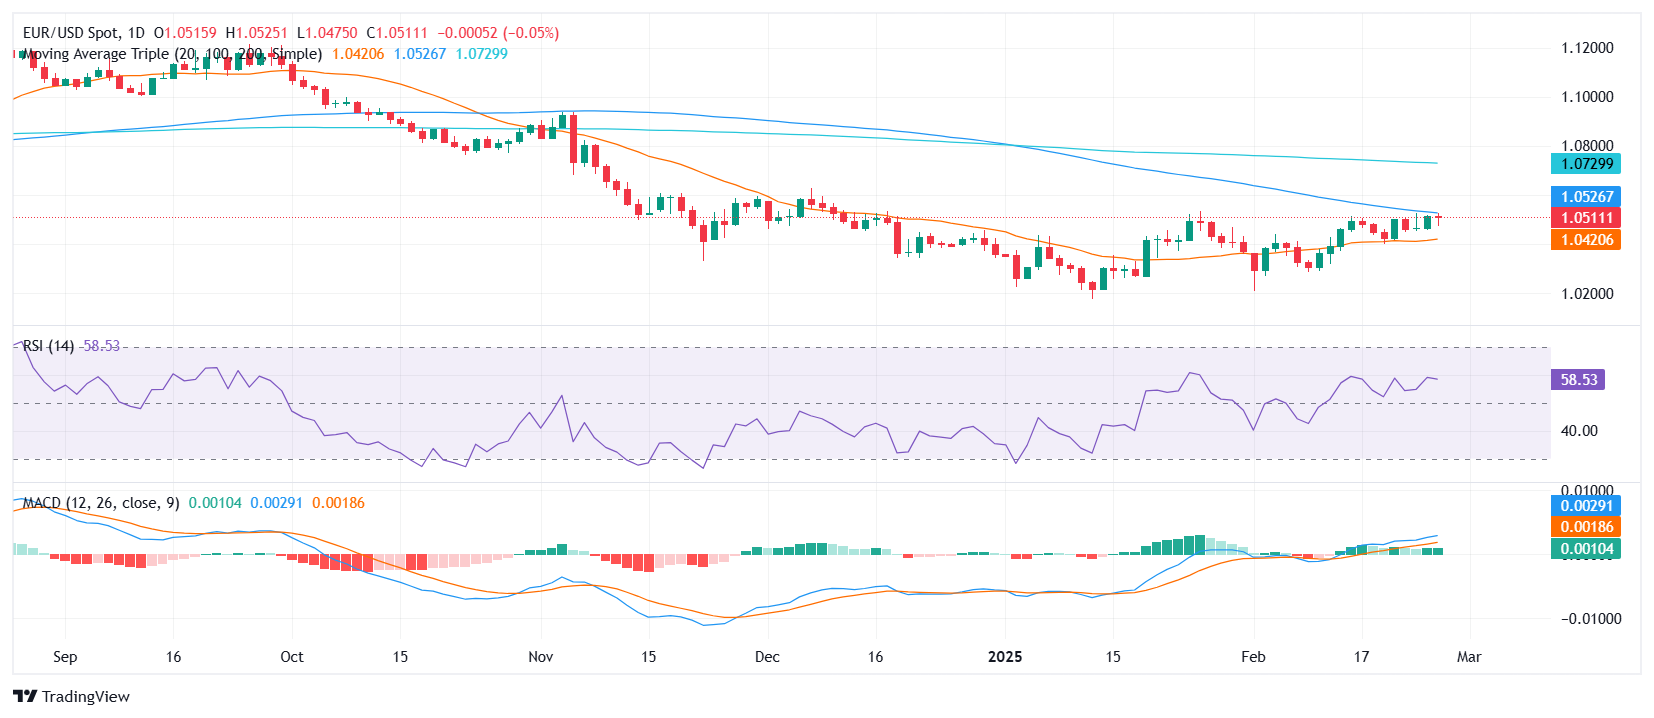
  • EUR/USD registers another decline after facing its third rejection at the 100-day SMA.
  • RSI remains in positive territory but declines sharply, signaling fading bullish momentum.
  • The 100-day and 20-day SMAs are converging, hinting at a possible bearish crossover.

EUR/USD continued to struggle on Wednesday, retreating after failing to break above the 100-day Simple Moving Average (SMA) for a third time. This repeated rejection suggests that bullish attempts are losing traction, while sellers are gradually regaining control. The confluence of technical indicators now hints at a potential shift in the broader outlook.

Technical readings point to weakening momentum. The Relative Strength Index (RSI) remains in positive territory but has turned lower, indicating that buyers are losing confidence. Meanwhile, the Moving Average Convergence Divergence (MACD) histogram prints flat green bars, reflecting a lack of strong directional conviction.

A key development to watch is the approaching convergence of the 100-day and 20-day SMAs, which could form a bearish crossover if the trend persists. A successful break below the 20-day SMA near the 1.0450 zone could reinforce downside risks, while any renewed attempt to breach the 100-day SMA would be critical for bullish continuation.

EUR/USD daily chart

Author

Patricio Martín

Patricio is an economist from Argentina passionate about global finance and understanding the daily movements of the markets.

More from Patricio Martín
Share:

Editor's Picks

EUR/USD: Breakdown below trading range support near 1.1770 comes into play

The EUR/USD pair opens with a bearish gap at the start of a new week as the US-Iran war-led global flight to safety boosts the US Dollar. Spot prices, however, lack follow-through selling and manage to hold above mid-1.1700s during the Asian session.

GBP/USD targets 1.3500 barrier near moving averages

GBP/USD rebounds from the daily losses, trading around 1.3450 during the Asian hours on Monday. The technical analysis of the daily chart indicates an ongoing bearish bias, as the pair trades within a descending channel pattern.

Gold jumps over 2% toward $5,400 after US, Israel attack Iran

Gold is on fire at the start of the week, a widely expected move, as investors seek harbor in the traditional store of value, following the continued US and Israel attacks on Iran. The bright metal opened with a bullish gap of about $17 and rallied toward the $5,400 level as Asian traders hit their desks and reacted negatively to the weekend news of the Middle East conflict, rushing for cover in Gold.

Top Crypto Losers: Tezos, Toncoin, and Polkadot at crucial levels amid US-Israel strike on Iran

Altcoins such as Tezos, Toncoin, and Polkadot rank among the worst hit cryptocurrencies over the last 24 hours amid the US and Israel's attack on Iran. Tezos and Toncoin are down to crucial support levels while Polkadot remains near a crucial resistance trendline, showcasing underlying strength.

The market is paying for insurance, not apocalypse

As expected, this morning felt less like a Monday market open and more like a fire drill. Futures screens flickered red. S&P contracts down almost 1%. Nasdaq off 1.2%. Brent leaped 13% through $80. Gold rose 1.6% toward $5350 before paring some gains. The dollar is strutting mildly. The Swiss franc is quietly doing what it always does in a storm, catching some safe-haven flows.

Starknet unveils strkBTC, shielded Bitcoin transactions on Ethereum Layer 2

Starknet, the Ethereum Layer 2 network developed by StarkWare, today announced strkBTC, a wrapped Bitcoin asset that introduces optional shielding while preserving full DeFi composability.