|

EUR/USD Price Analysis: Bulls eye an extended rally towards monthly targets

  • EUR/USD meets critical resistance and could be on the verge of a correction. 
  • The bears will be looking for a restest of the 1.1400 area.
  • Bulls have their eyes on longer-term 1.17 area as a monthly objective. 

The price of EUR/USD  is leaving a monthly M-formation which is seen with ease on the line chart for which is a reversion pattern. The price would be expected to revisit the neckline of the formation, in which case in the above illustration is identified near 1.1730.

EUR/USD monthly chart 

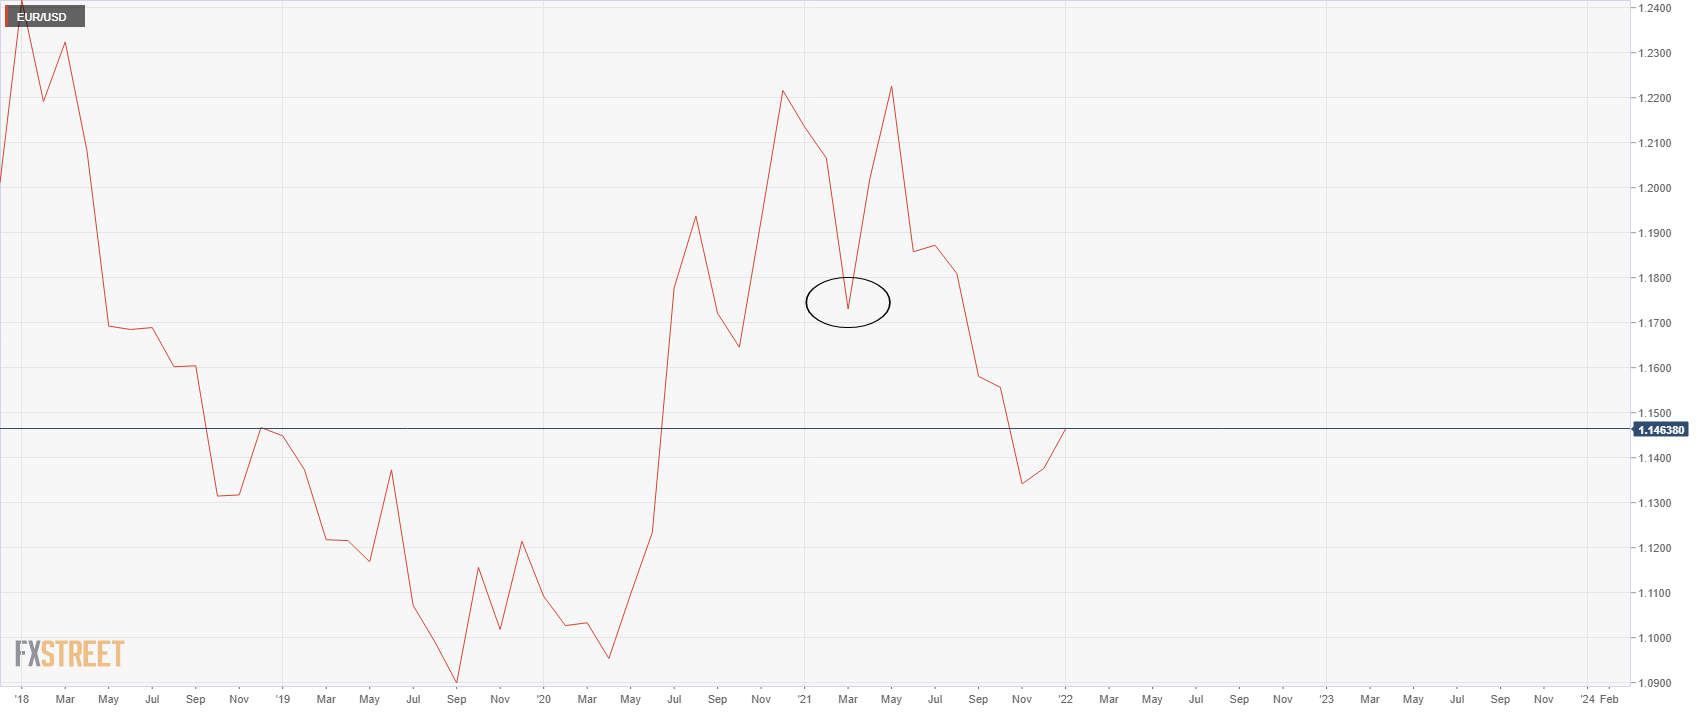
However, there is plenty of resistance structure on the way there and ground to cover. The first notable area of resistance will be within the 1.15 area as seen on the daily chart as follows:

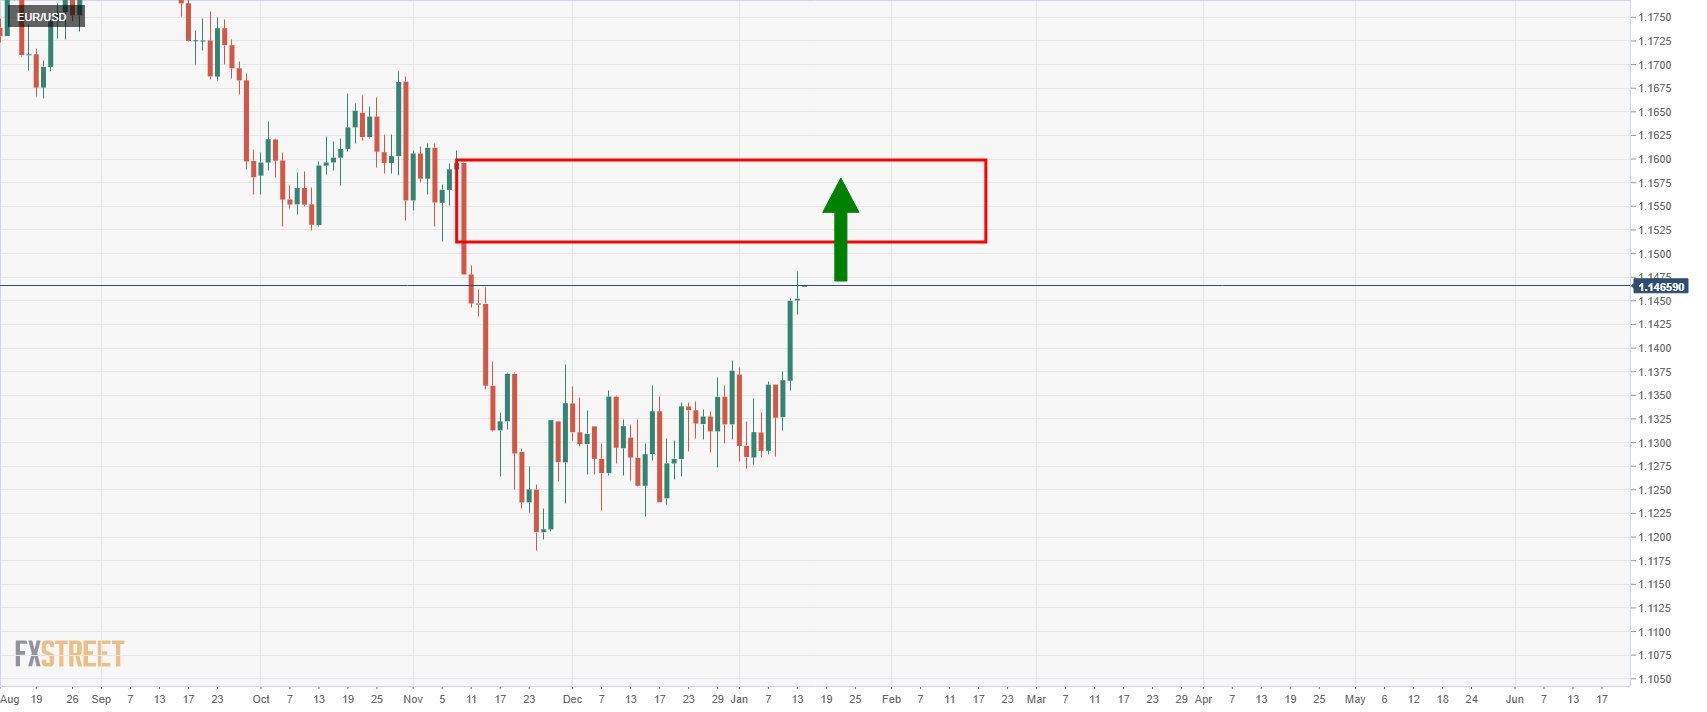
the, on a lower time frame basis, we can identify some Wycoff methodology characteristics as follows:

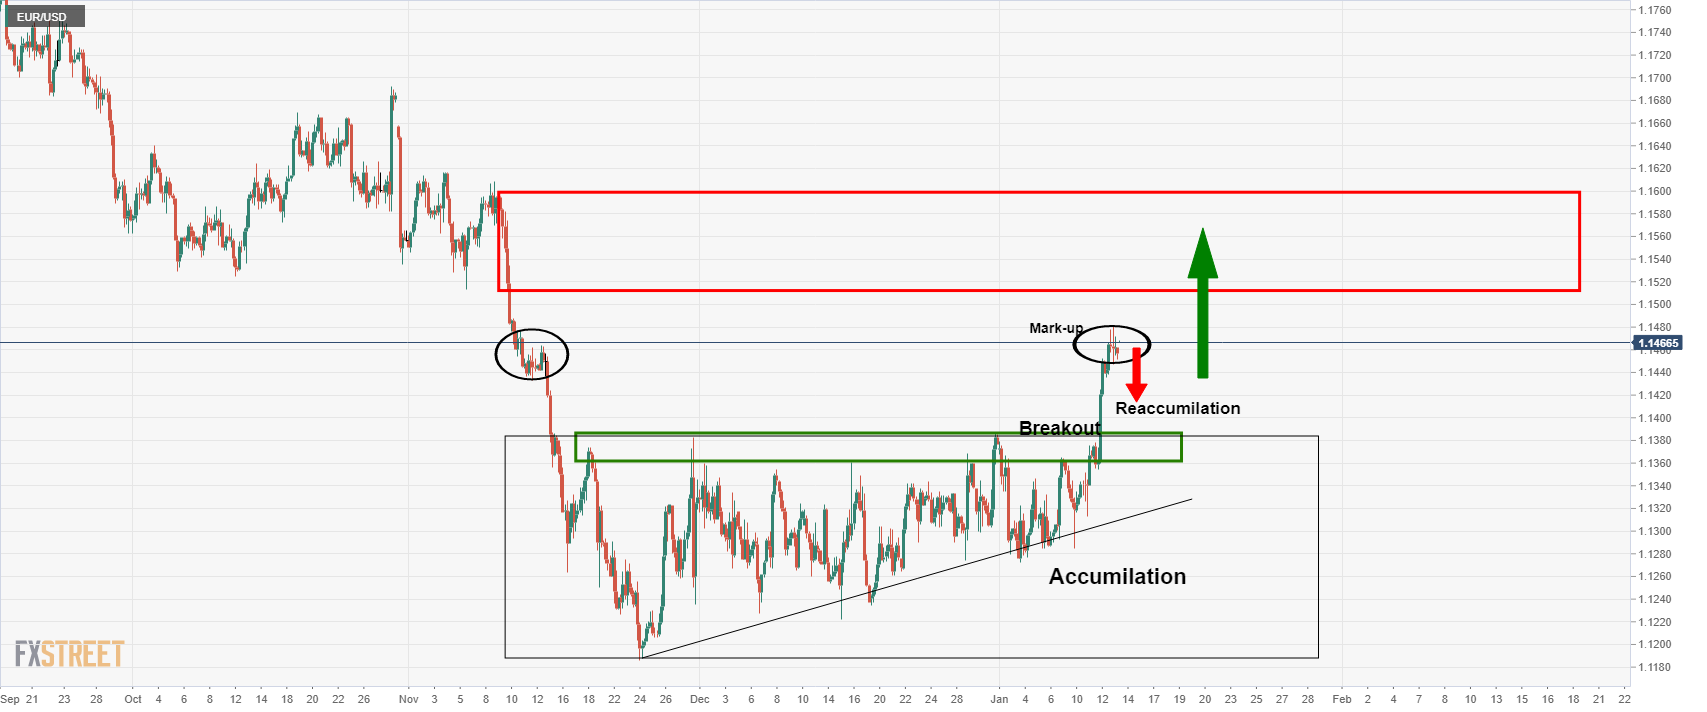
The 4-hour chart shows a period of accumulation that has recently seen a breakout, termed as the ''mark-up''. There is only so far that the price can rally before it meets sellers and should the buyers move in at a discount, then the price would be expected to ''accumulate'' and move higher to mitigate the next imbalance of price towards the monthly M-formation's neckline. 

This process would be expected to take days, if not weeks to play out, however:

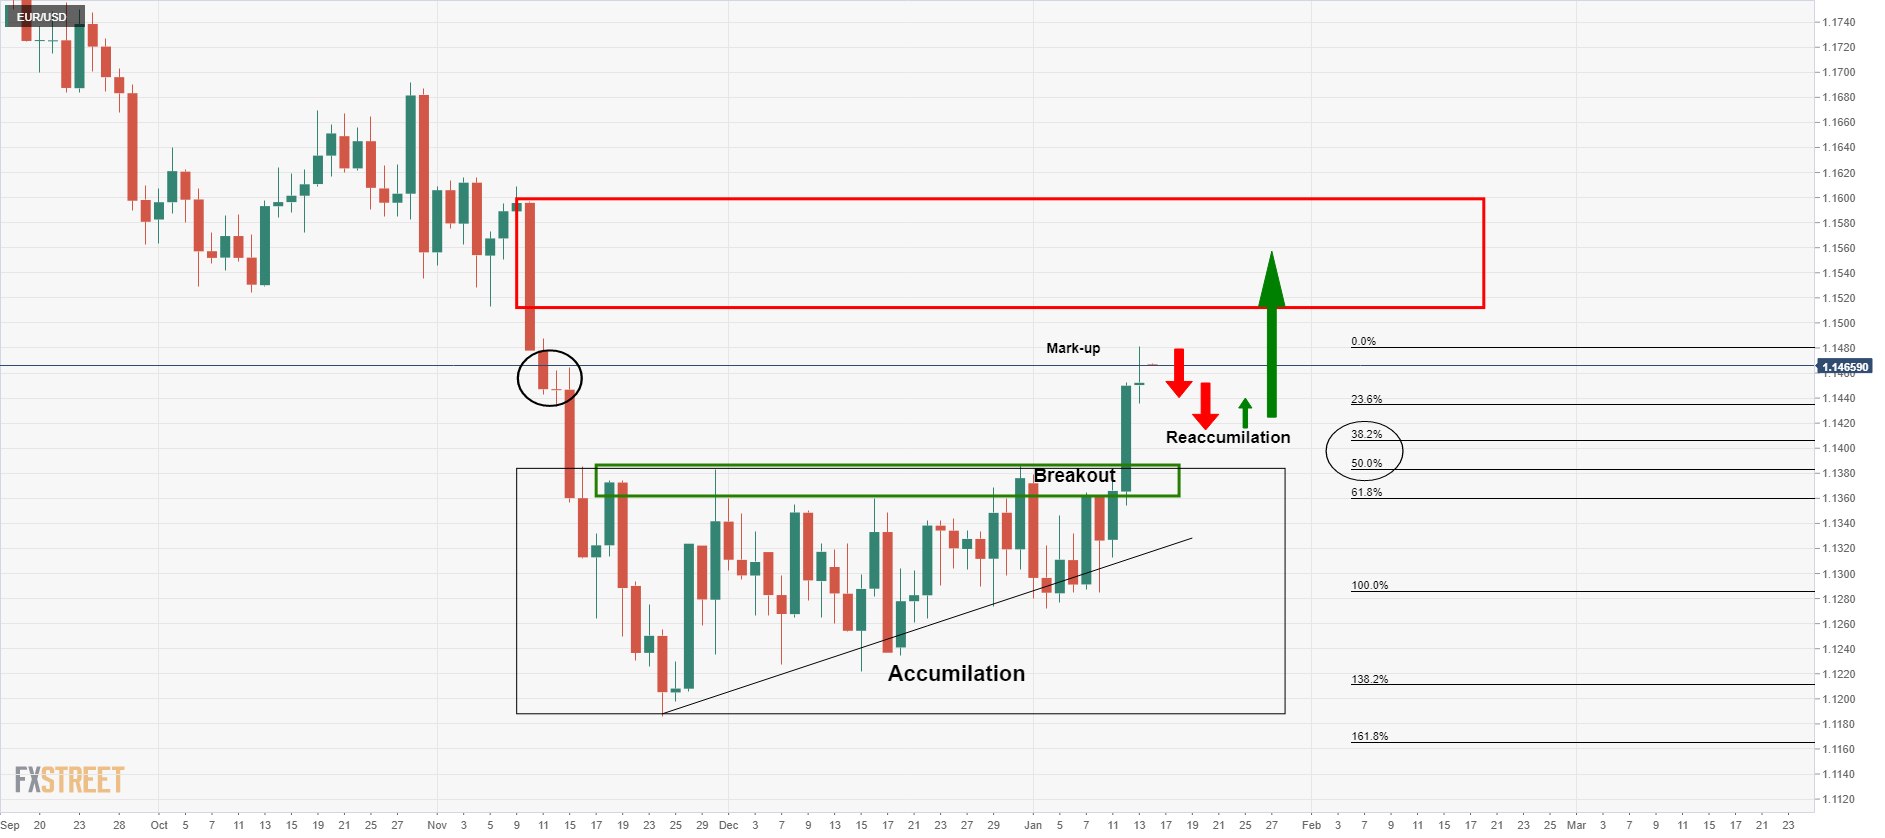
From a daily perspective, the bears will have their eye son at least a 38.2% Fibo retracement towards 1.14 the figure of not a full 50% mean reversion to the breakout point near 1.1380. 

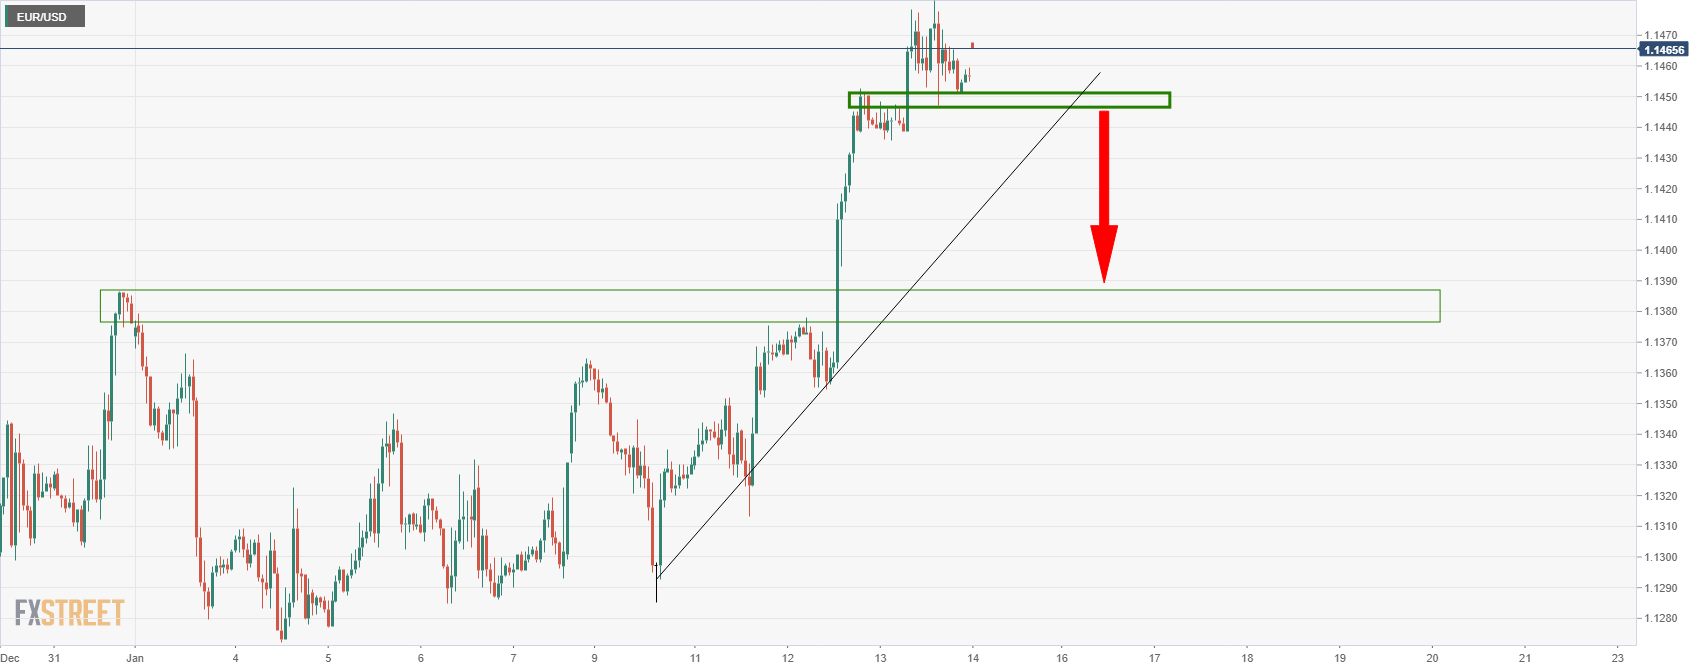
In the meantime, a sideways period of consolidation would be expected as per the following hourly chart:

Author

Ross J Burland

Ross J Burland, born in England, UK, is a sportsman at heart. He played Rugby and Judo for his county, Kent and the South East of England Rugby team.

More from Ross J Burland
Share:

Editor's Picks

EUR/USD remains offered below 1.1600, seems vulnerable near multi-month low

The EUR/USD pair struggles to capitalize on the overnight bounce from the 1.1530 region, or the lowest level since November 2025, and lower for the third consecutive day on Wednesday. Spot prices slide back below the 1.1600 mark during the Asian session and seem vulnerable to slide further.

GBP/USD slips below key averages as geopolitical risks mount

GBP/USD fell about 0.35% on Tuesday, settling around 1.3350 after slipping below the 200-day Exponential Moving Average for the first time since early December. The pair has pulled back sharply from its late-January high near 1.3870, shedding over 500 pips in a series of lower highs and lower lows. 

Gold rebounds ahead of US ADP, will it last?

Gold finds renewed Asian bids and retests $5,230 early Wednesday after the heavy sell-off on Tuesday. The US Dollar stands tall amid escalating Middle East tensions and reduced dovish Fed expectations. Gold defends $5,000 or 50% Fibo level after facing rejection at the 78.6% Fibo resistance at $5,342 amid bullish RSI.  

Ethereum: Whales step up buying as short positions contract

After holding firm heading into the last weekend, Ethereum whales have returned to action, pouncing on the volatility stemming from escalating military actions between the US and Iran.

Energy shock 2.0: Why rising Gas prices could hit the Euro

Even without a confirmed, sustained disruption, the mere risk to a key global energy chokepoint is enough to inject a significant premium into European Gas markets. And for the Euro, that matters.

Ripple falters amid sell-off jitters and negative funding rates

Ripple (XRP) has come under pressure, drifting lower to $1.35 at the time of writing on Tuesday. The over 2% correction looks poised to erase the previous day’s gains, which lifted the remittance token to $1.42.