EUR/USD Price Analysis: Bearish channel, 200-HMA challenge latest run-up


  • EUR/USD picks up bids to refresh intraday high, prints two-day uptrend inside weekly bearish channel.
  • Clear upside break of one-week-old descending trend line, bullish MACD signals favor buyers.
  • Downside remains elusive unless breaking 1.0660 support line.

EUR/USD bulls keep the reins as markets brace for the preliminary readings of the fourth quarter (Q4) Eurozone Gross Domestic Product (GDP) and the US Consumer Price Index (CPI) for January during early Tuesday. That said, the major currency pair renews its intraday high near 1.0740 by the press time.

Also read: EUR/USD advances towards 1.0770 as USD Index struggles to find cushion ahead of US CPI

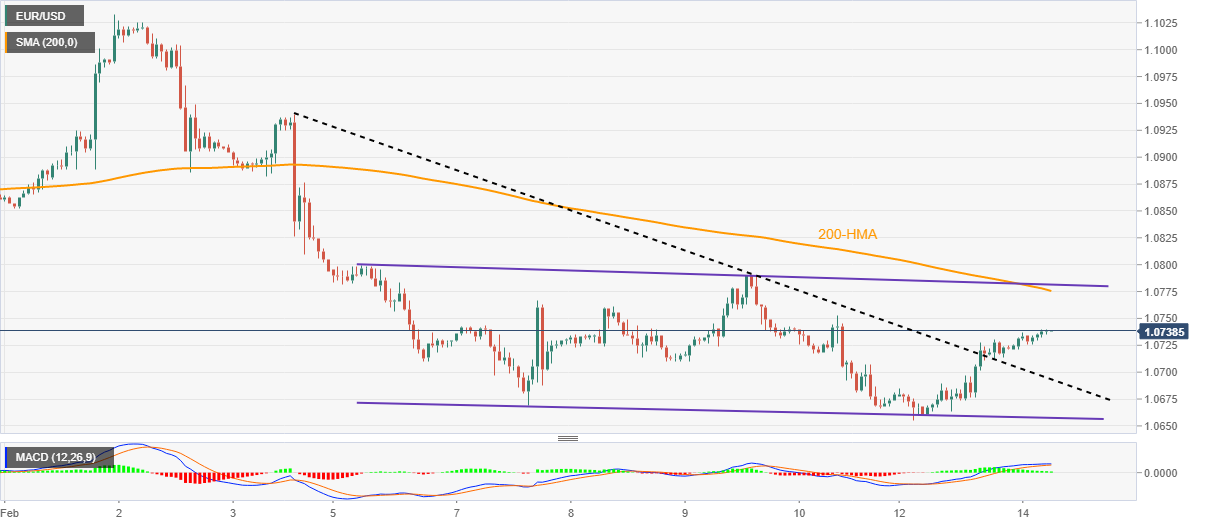
The quote’s latest advances could be linked to the successful break of the descending resistance line from February 03, now support around 1.0700. Also favoring the EUR/USD buyers are the bullish MACD signals.

It’s worth noting, however, that a convergence of the 200-Hour Moving Average (HMA) joins the top line of a one-week-old descending trend channel to offer a tough nut to crack for the EUR/USD bulls around 1.0780.

Following that, the 1.0800 round figure may act as an extra filter towards the north before directing the pair towards the monthly peak of around 1.1035.

On the flip side, a clear break of the resistance-turned-support line, close to 1.0700 at the latest, isn’t an open welcome to the EUR/USD bears as the aforementioned channel’s lower line acts as the last defense of the Euro pair buyers around 1.0655.

Should the EUR/USD pair remains bearish past 1.0655, the odds of witnessing a slump toward January’s low near 1.0485 can’t be ruled out.

EUR/USD: Hourly chart

Trend: Further upside expected

Additional important levels

Overview
Today last price 1.0736
Today Daily Change 0.0013
Today Daily Change % 0.12%
Today daily open 1.0723
 
Trends
Daily SMA20 1.082
Daily SMA50 1.0711
Daily SMA100 1.0374
Daily SMA200 1.0324
 
Levels
Previous Daily High 1.073
Previous Daily Low 1.0656
Previous Weekly High 1.0799
Previous Weekly Low 1.0666
Previous Monthly High 1.093
Previous Monthly Low 1.0483
Daily Fibonacci 38.2% 1.0702
Daily Fibonacci 61.8% 1.0684
Daily Pivot Point S1 1.0676
Daily Pivot Point S2 1.0628
Daily Pivot Point S3 1.0601
Daily Pivot Point R1 1.075
Daily Pivot Point R2 1.0777
Daily Pivot Point R3 1.0825


Share: Feed news

Information on these pages contains forward-looking statements that involve risks and uncertainties. Markets and instruments profiled on this page are for informational purposes only and should not in any way come across as a recommendation to buy or sell in these assets. You should do your own thorough research before making any investment decisions. FXStreet does not in any way guarantee that this information is free from mistakes, errors, or material misstatements. It also does not guarantee that this information is of a timely nature. Investing in Open Markets involves a great deal of risk, including the loss of all or a portion of your investment, as well as emotional distress. All risks, losses and costs associated with investing, including total loss of principal, are your responsibility. The views and opinions expressed in this article are those of the authors and do not necessarily reflect the official policy or position of FXStreet nor its advertisers. The author will not be held responsible for information that is found at the end of links posted on this page.

If not otherwise explicitly mentioned in the body of the article, at the time of writing, the author has no position in any stock mentioned in this article and no business relationship with any company mentioned. The author has not received compensation for writing this article, other than from FXStreet.

FXStreet and the author do not provide personalized recommendations. The author makes no representations as to the accuracy, completeness, or suitability of this information. FXStreet and the author will not be liable for any errors, omissions or any losses, injuries or damages arising from this information and its display or use. Errors and omissions excepted.

The author and FXStreet are not registered investment advisors and nothing in this article is intended to be investment advice.

Recommended content


Recommended content

Editors’ Picks

EUR/USD resumes slide and nears intraday lows

EUR/USD resumes slide and nears intraday lows

The US Dollar resumed its advance after discouraging US data and as Wall Street turned south. EUR/USD accelerates below 1.0800 as recession signs outpace hopes for upcoming rate cuts.

EUR/USD News

GBP/USD accelerates its decline and flirts with 1.2750

GBP/USD accelerates its decline and flirts with 1.2750

The prevailing risk-off tone in the broader FX world weighs on the British pound and its peers, sending GBP/USD back to the area of four-week lows near 1.2750.

GBP/USD News

Gold consolidates gains around $2,450

Gold consolidates gains around $2,450

After falling to $2,430 earlier in the day, Gold regains its traction and trades at around $2,450 in the American session. The benchmark 10-year US Treasury bond yield is down more than 1% on the day below 4% after weak US data, allowing XAU/USD to hold its ground.

Gold News

Crypto Today: Bitcoin holders accumulate without fear, Ethereum struggles while XRP holds gains steady

Crypto Today: Bitcoin holders accumulate without fear, Ethereum struggles while XRP holds gains steady

Bitcoin long-term holders have continued to accumulate BTC consistently in the last two months. Ethereum hovers around $3,100, struggles to make a comeback to resistance at $3,500.

Read more

Bank of England cuts rates and there are more to come this year

Bank of England cuts rates and there are more to come this year

The Bank of England is staying tight-lipped on when it expects to cut rates again. But we think better news on services inflation and wage growth can unlock one, or more likely two rate cuts by year-end.

Read more

Forex MAJORS

Cryptocurrencies

Signatures