EUR/USD path of least resistance is down ahead of critical data – Confluence Detector

EUR/USD has been on the back foot amid some calm on the trade front and as Brexit grabs the headlines. The world's most popular currency pair is now awaiting German inflation figures and an update on US GDP. How is it positioned on the chart?
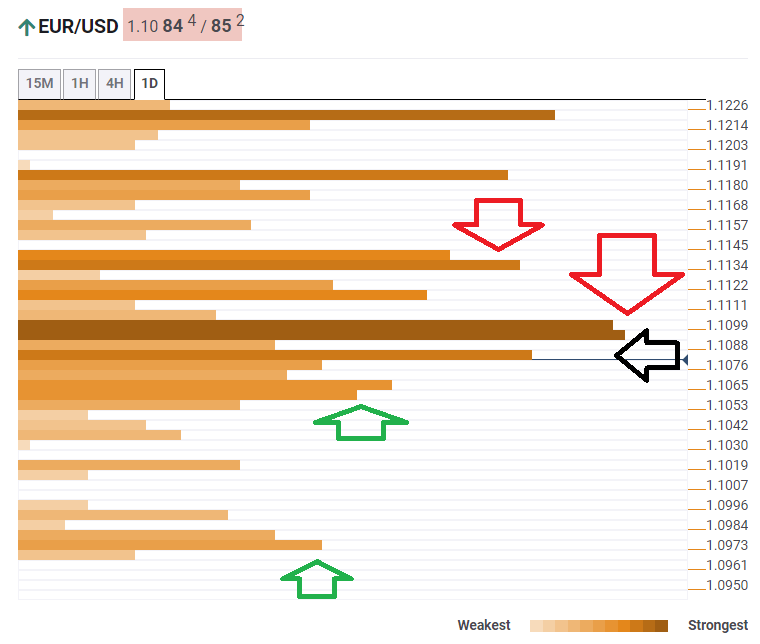
The Technical Confluences Indicator is struggling 1.1082, which is the convergence of the Pivot Point one-week Support 1, the Fibonacci 23.6% one-day, the Bollinger Band 15min-Lower, and the Simple Moving Average 10-1h.
A dense cluster of lines caps EUR/USD around 1.1095. This includes the Fibonacci 61.8% one-day, the previous 4h-high, the Fibonacci 61.8% one-week, the PP 1d-R1, the SMA 200-1h, the SMA 10-1d, the SMA 50-4h, the SMA 5-1d.
If it manages to move higher, the next cap is 1.1134, where the Fibonacci 23.6% one-week and the BB 1d-Middle converge.
Looking down, weaker support awaits at 1.1065, where the PP 1d-S2 and the previous monthly low meet.
The next noteworthy cushion is only at 1.0973, where we see the confluence of the PP 1m-S1 and the PP 1w-S3.
Here is how it looks on the tool:
Confluence Detector
The Confluence Detector finds exciting opportunities using Technical Confluences. The TC is a tool to locate and point out those price levels where there is a congestion of indicators, moving averages, Fibonacci levels, Pivot Points, etc. Knowing where these congestion points are located is very useful for the trader, and can be used as a basis for different strategies.
This tool assigns a certain amount of “weight” to each indicator, and this “weight” can influence adjacents price levels. These weightings mean that one price level without any indicator or moving average but under the influence of two “strongly weighted” levels accumulate more resistance than their neighbors. In these cases, the tool signals resistance in apparently empty areas.
Author

Yohay Elam
FXStreet
Yohay is in Forex since 2008 when he founded Forex Crunch, a blog crafted in his free time that turned into a fully-fledged currency website later sold to Finixio.


