|

EUR/USD paddles near 1.1050 to round out 2023

  • EUR/USD is holding steady in thin markets to wrap up the trading year.
  • The Euro is set for a 3% gain against the US Dollar for the year.
  • US data continues to miss the mark as the economic outlook softens.

The EUR/USD is trading flat on Friday, the last trading session of 2023. The Euro (EUR) is on pace to close up 3% against the US Dollar (USD) for 2023, rallying 5.8% from the year’s bottom bids near 1.0450 in October. The EUR/USD is still down nearly 2% from 2023’s peak at 1.1275 set in July, but the pair is leaning firmly into the bullish side as broader markets continue to sell off the Greenback in anticipation of rate cuts from the Federal Reserve (Fed) in 2024.

US Dollar to end 2023 on the low side as markets bet big on rate cuts

With meaningful Eurozone economic data absent from the calendar until the HCOB Eurozone Composite Purchasing Managers’ Index (PMI) on January 4, it’s up to the US data docket to do the heavy lifting to round out the trading year.

The US Chicago PMI for December missed the mark on Friday, printing at a contractionary 46.9 versus November’s 18-month peak of 55.8, slipping past the median market forecast of 51.0. Softening economic data from the US continues to counter-intuitively bolster market risk appetite, as a weakening economic outlook increases the odds of an accelerated pace of rate hikes from the Fed in 2024. Investor expectations have run well ahead of the Fed’s own rate outlook for next year, which currently sees up to 75 basis points in rate cuts through the end of 2024; money markets are pricing in upwards of 160 basis points to come off the Fed’s main reference rate by the end of next December.

EUR/USD Technical Outlook

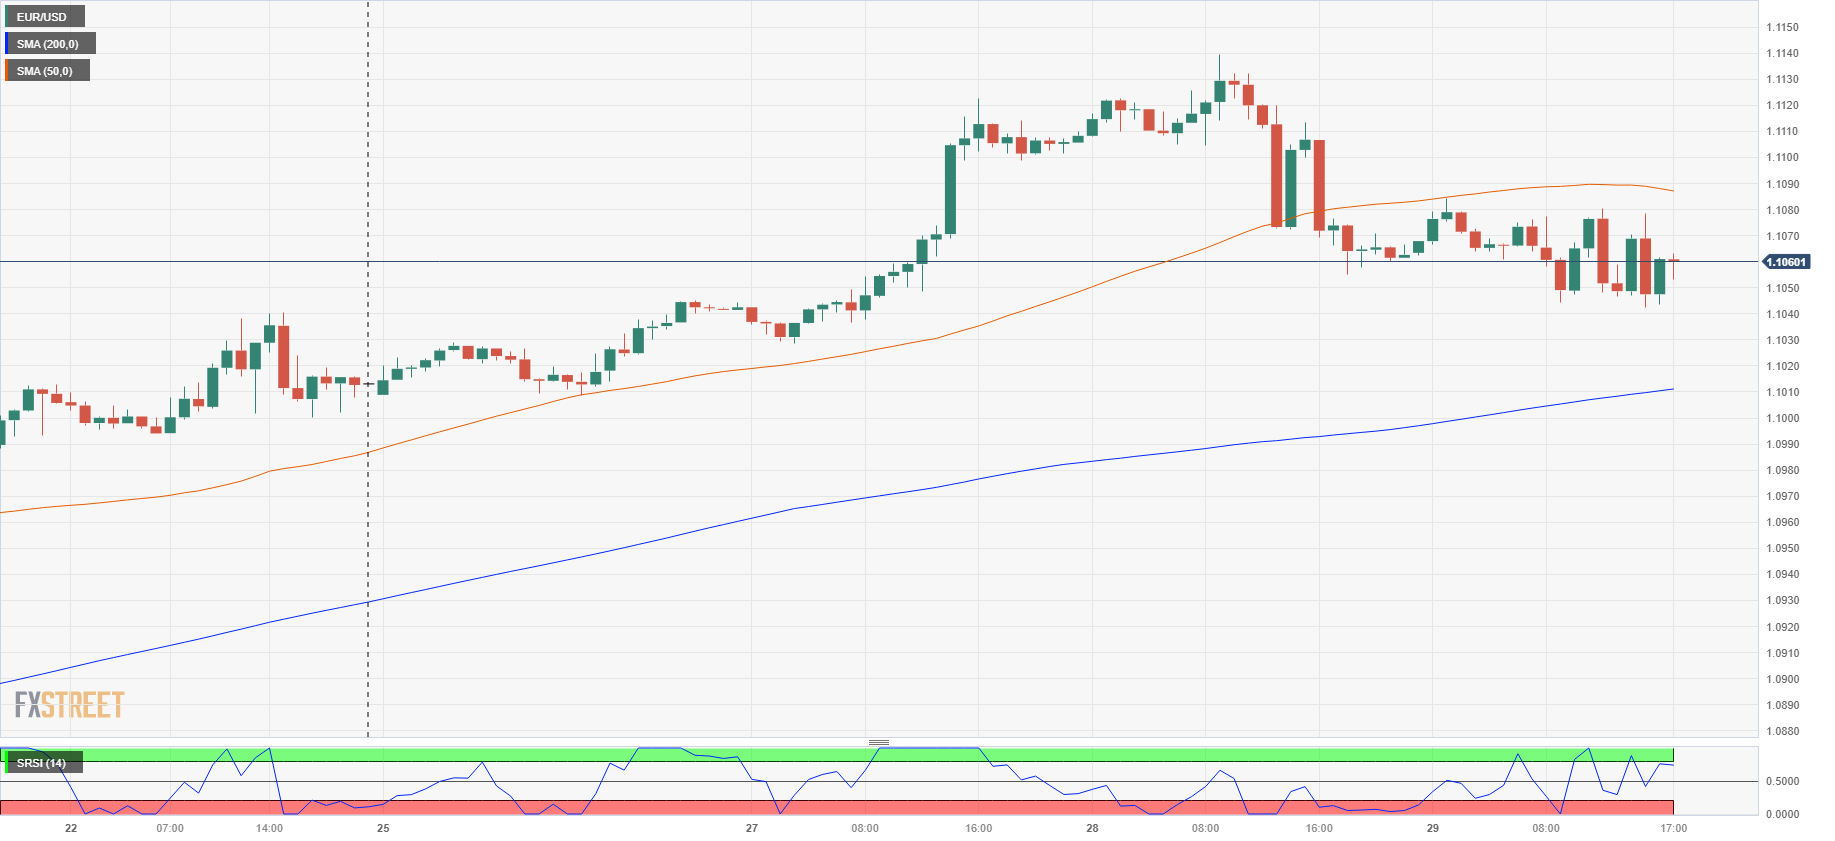
With the EUR/USD stuck in place near 1.1050 on the intraday charts, the Euro is set to drift between the 50-hour and 200-hour Simple Moving Averages (SMAs) as the 2023 trading year rounds the corner into 2024. 

A protracted post-holiday trading week will give way to another extended holiday following the New Year’s market closures, and the EUR/USD is set to head into the new year catching technical support from the 200-hour SMA just above the 1.1000 handle.

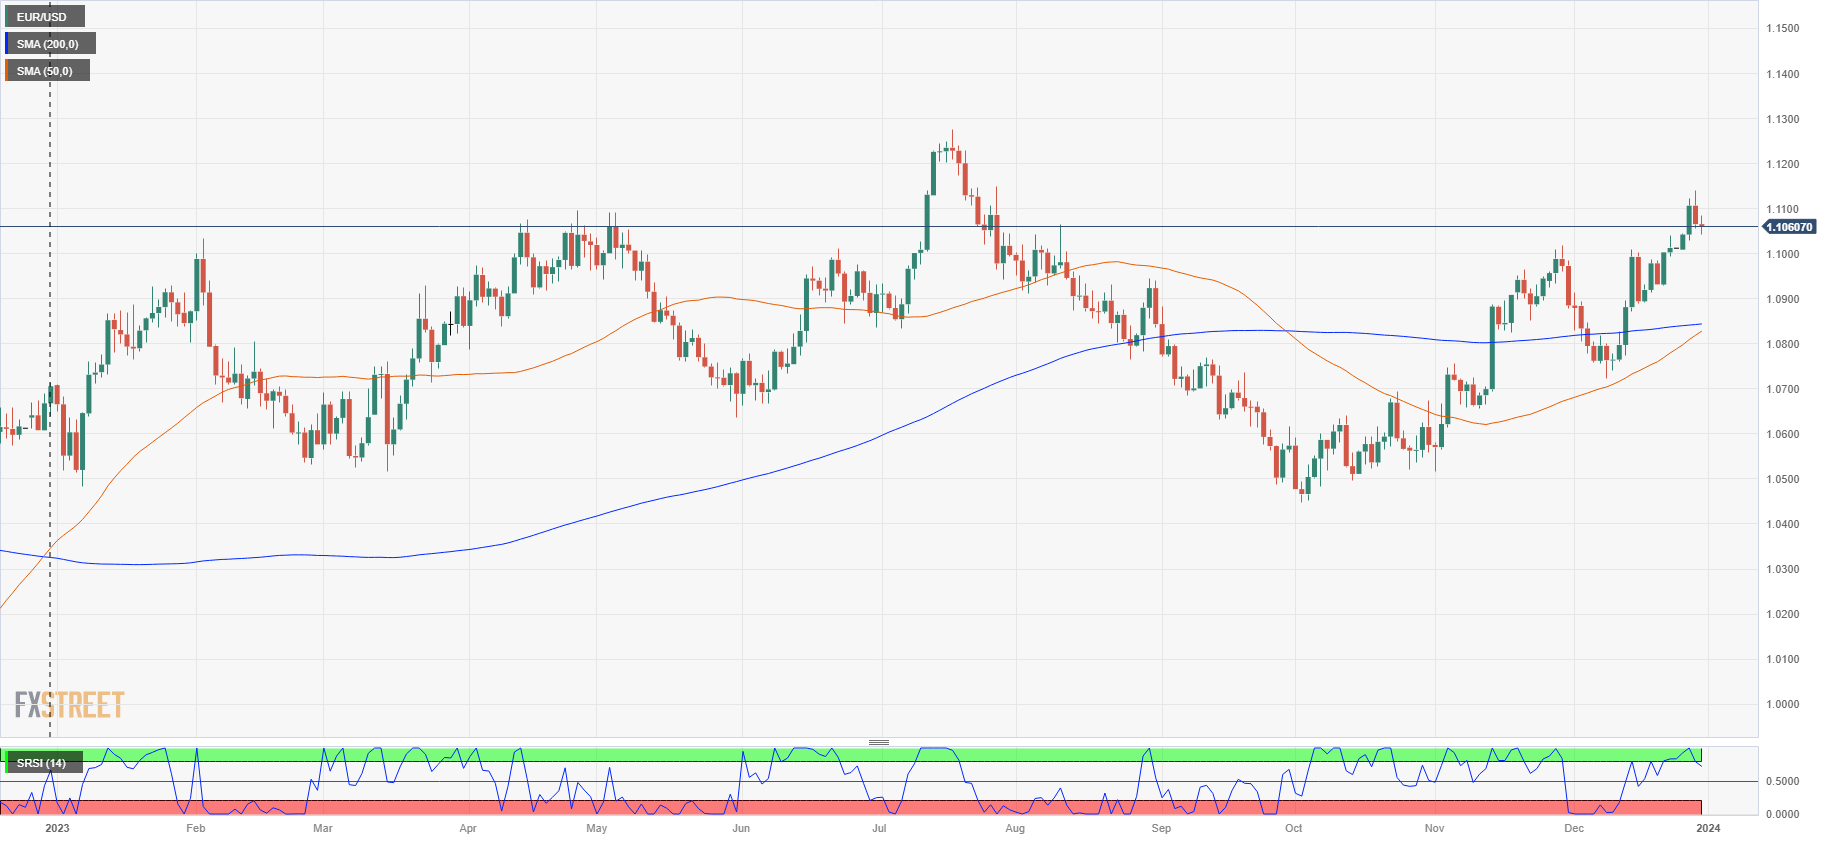
Daily candlesticks tell a notably overbought story with the Euro pulling back from Thursday’s multi-month highs near 1.1150 and the 50-day SMA accelerating into a bullish cross of the 200-day SMA near 1.0850. Technical indicators are also flashing warning signs of a possible extended pullback with the Relative Strength Index (RSI) flashing a retreat from overbought conditions on a 14-day basis.

EUR/USD Hourly Chart
EUR/USD Daily Chart
EUR/USD Technical Levels

EUR/USD

Overview
Today last price1.106
Today Daily Change-0.0006
Today Daily Change %-0.05
Today daily open1.1066
 
Trends
Daily SMA201.0912
Daily SMA501.0819
Daily SMA1001.0758
Daily SMA2001.0843
 
Levels
Previous Daily High1.114
Previous Daily Low1.1055
Previous Weekly High1.104
Previous Weekly Low1.0892
Previous Monthly High1.1017
Previous Monthly Low1.0517
Daily Fibonacci 38.2%1.1087
Daily Fibonacci 61.8%1.1107
Daily Pivot Point S11.1034
Daily Pivot Point S21.1002
Daily Pivot Point S31.095
Daily Pivot Point R11.1118
Daily Pivot Point R21.1171
Daily Pivot Point R31.1203

Author

Joshua Gibson

Joshua joins the FXStreet team as an Economics and Finance double major from Vancouver Island University with twelve years' experience as an independent trader focusing on technical analysis.


More from Joshua Gibson
Share:

Editor's Picks

GBP/USD holds range near 1.3500 after UK Q2 GDP

GBP/USD keeps its range near the 1.3500 psychological mark in the European session on Thursday. The mixed UK GDP and industrial data failed to inspire the British Pound. Meanwhile, the US Dollar stabilizes after the US CPI data-led sell-off, checking any upside attempts in the pair.

EUR/USD flatlines above 1.1500 as US Dollar stablizes ahead of PPI

EUR/USD is trading modestly flat above 1.1500 in European trading hours on Thursday. The pair stalls its rebound as the US Dollar consolidates losses incurred after the release of July's Consumer Price Index report. Inflation in the US moderated across a broad range of goods and services, cooling expectations for an aggressive Federal Reserve rate hike in September and weighing on the Greenback. The US PPI data is next in focus.

Gold weakens further below $4,400 as USD sticks to gains amid Fed bets, Iran tensions

Gold extends its intraday retracement slide from the highest level since June 5, around the $4,450 area touched earlier this Thursday, and slides further below the $4,400 mark heading into the European session. The initial market reaction to signs of moderating US inflation fades quickly as investors remain worried that higher energy prices will rekindle inflationary pressures.

XRP holds at make-or-break level, ADA and SOL risk 50-day EMA breakout

Top altcoins, including Ripple, Cardano, and Solana, are facing downside pressure, holding at crucial support levels. The technical outlook for XRP, ADA, and SOL indicates a mild bearish bias as downside pressure mounts.

Gold has priced a Fed pause. The hike is still coming
July inflation landed exactly where the consensus had it, on all four lines of the release, and Gold responded by adding around 1% and holding fast near $4,400/ounce, trading at its highest since early June. A print that surprises nobody is not supposed to move a metal that far.
Why is Crude Oil priced for a reopening the ships haven't made?
Fourteen vessels crossed the Strait of Hormuz on Tuesday. Before the war, the count ran near 120 a day. In the sessions since the waterway was publicly declared open, Brent has drifted back to $87 and West Texas Intermediate (WTI) to $81, both a little lower again on Wednesday, with daily momentum on each unwound from the top of its range in late July to the low twenties now.