EUR/SEK Price Analysis: Traders seem non-committed above 11.80 amid mixed technical setup


  • EUR/SEK touches a three-day high on Friday, albeit lacks follow-through.
  • The formation of a multiple-top on the daily chart favours bearish traders.
  • Repeated failures to find acceptance below the 11.80 level warrant caution.

The EUR/SEK pair edges higher for the third straight day on Friday and touches a three-day high level of 11.8978 during the Asian session, albeit lacks bullish conviction.

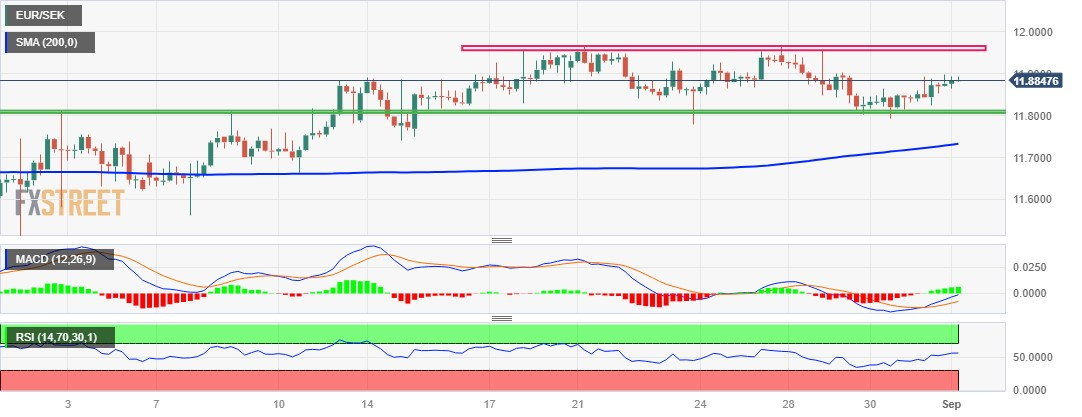
From a technical perspective, the recent repeated failures ahead of the 12.00 round figure constitute the formation of a bearish multiple-top pattern on the daily chart. The EUR/SEK pair, however, has been showing some resilience below a previous strong resistance breakpoint, now turned support around the 11.80 region, which should now act as a pivotal point.

Meanwhile, oscillators on the daily chart are still holding in the bullish territory and have again started gaining positive traction on the 4-hour chart. This further makes it prudent to wait for strong follow-through selling and acceptance below the 11.80 area before traders start positioning for any meaningful corrective decline from the all-time peak touched in August.

The EUR/SEK pair might then accelerate the downfall towards the 11.7500 horizontal zone en route to the 11.7050 area. This is followed by support near the 11.6600 level, which if broken decisively will suggest that spot prices have topped out in the near term and set the stage for a further depreciating move.

On the flip side, bulls need to wait for a convincing breakout through the multiple-top barrier near the 11.95 region before placing fresh bets. The EUR/SEK pair might then prolong its well-established uptrend from the July swing low, around the 11.40 area.

EUR/SEK 4-hour chart

fxsoriginal

Technical levels to watch

EUR/SEK

Overview
Today last price 11.8875
Today Daily Change 0.0105
Today Daily Change % 0.09
Today daily open 11.877
 
Trends
Daily SMA20 11.8265
Daily SMA50 11.7275
Daily SMA100 11.5932
Daily SMA200 11.3769
 
Levels
Previous Daily High 11.8958
Previous Daily Low 11.8153
Previous Weekly High 11.9646
Previous Weekly Low 11.7798
Previous Monthly High 11.9664
Previous Monthly Low 11.4122
Daily Fibonacci 38.2% 11.865
Daily Fibonacci 61.8% 11.8461
Daily Pivot Point S1 11.8296
Daily Pivot Point S2 11.7822
Daily Pivot Point S3 11.7491
Daily Pivot Point R1 11.9101
Daily Pivot Point R2 11.9432
Daily Pivot Point R3 11.9906


Share: Feed news

Information on these pages contains forward-looking statements that involve risks and uncertainties. Markets and instruments profiled on this page are for informational purposes only and should not in any way come across as a recommendation to buy or sell in these assets. You should do your own thorough research before making any investment decisions. FXStreet does not in any way guarantee that this information is free from mistakes, errors, or material misstatements. It also does not guarantee that this information is of a timely nature. Investing in Open Markets involves a great deal of risk, including the loss of all or a portion of your investment, as well as emotional distress. All risks, losses and costs associated with investing, including total loss of principal, are your responsibility. The views and opinions expressed in this article are those of the authors and do not necessarily reflect the official policy or position of FXStreet nor its advertisers. The author will not be held responsible for information that is found at the end of links posted on this page.

If not otherwise explicitly mentioned in the body of the article, at the time of writing, the author has no position in any stock mentioned in this article and no business relationship with any company mentioned. The author has not received compensation for writing this article, other than from FXStreet.

FXStreet and the author do not provide personalized recommendations. The author makes no representations as to the accuracy, completeness, or suitability of this information. FXStreet and the author will not be liable for any errors, omissions or any losses, injuries or damages arising from this information and its display or use. Errors and omissions excepted.

The author and FXStreet are not registered investment advisors and nothing in this article is intended to be investment advice.

Recommended content


Recommended content

Editors’ Picks

EUR/USD recovers toward 1.0500 after mixed US PMI data

EUR/USD recovers toward 1.0500 after mixed US PMI data

EUR/USD rebounds toward 1.0500 in the American session on Friday after the data from the US showed that the business activity in the private sector expanded at a softer pace than anticipated in early February. The pair remains on track to end the week with little changed.

EUR/USD News
GBP/USD rises above 1.2650, looks to post weekly gains

GBP/USD rises above 1.2650, looks to post weekly gains

GBP/USD regains its traction and trades above 1.2650 in the second half of the day on Friday. The data from the US showed that the S&P Global Services PMI dropped into the contraction territory below 50 in February, causing the US Dollar to lose strength and helping the pair edge higher.

GBP/USD News
Gold holds above $2,930 as US yields edge lower

Gold holds above $2,930 as US yields edge lower

Gold holds above $2,930 after correcting from the record-high it set above $2,950 on Thursday. Following the mixed PMI data from the US, the benchmark 10-year US Treasury bond yield stays in negative territory below 4.5% and allows XAU/USD to hold its ground.

Gold News
Crypto exchange Bybit hacked for $1.4 billion worth of ETH

Crypto exchange Bybit hacked for $1.4 billion worth of ETH

Following a security breach first spotted by crypto investigator ZachXBT, crypto exchange Bybit announced that it suffered a hack where an attacker compromised one of its ETH wallets.

Read more
Money market outlook 2025: Trends and dynamics in the Eurozone, US, and UK

Money market outlook 2025: Trends and dynamics in the Eurozone, US, and UK

We delve into the world of money market funds. Distinct dynamics are at play in the US, eurozone, and UK. In the US, repo rates are more attractive, and bills are expected to appreciate. It's also worth noting that the Fed might cut rates more than anticipated, similar to the UK. In the eurozone, unsecured rates remain elevated.

Read more
The Best brokers to trade EUR/USD

The Best brokers to trade EUR/USD

SPONSORED Discover the top brokers for trading EUR/USD in 2025. Our list features brokers with competitive spreads, fast execution, and powerful platforms. Whether you're a beginner or an expert, find the right partner to navigate the dynamic Forex market.

Read More

Forex MAJORS

Cryptocurrencies

Signatures

Best Brokers of 2025