EUR/NZD technical analysis: The pair is showing signs of breaking lower
- EUR/NZD breaks lower breaking consolidation patter.
- NZD rose last night after the retail electronic card sales data.

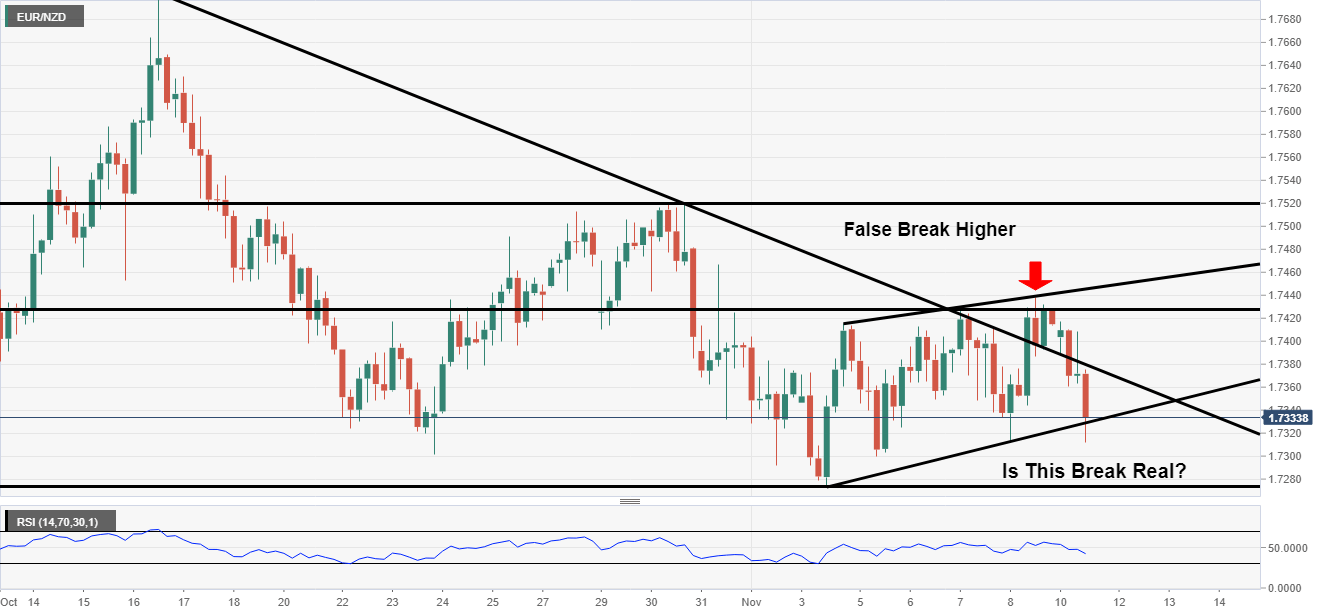
EUR/NZD 4-Hour Chart
EUR/NZD has pushed down today and currently trades 0.43% lower on the session.
Looking at the 4-hour chart below you can see there was a false break higher after the trendline break on November 8th.
Now the price has broken back into the trendline it has broken to the downside and broken the pattern to the downside.
No the support level in focus is at 1.7272 and before that 1.7325.
EUR/NZD Daily Chart
The daily chart is showing more of a bearish picture. The pattern broke to the downside on October 23rd.
Subsequently, the price broken back in and then pushed lower after mean-reverting.
Now the main support zone holds at 1.7279. If the price breaks lower it would confirm a lower high lower low and technical trend change.
-637090708451773535.png)
Author

Rajan Dhall, MSTA
FX Daily
Rajan Dhall is an experienced market analyst, who has been trading professionally since 2007 managing various funds producing exceptional returns.


