EUR/JPY Price Forecast: Tests ascending channel’s lower boundary around 162.50


  • The EUR/JPY cross tests the lower boundary of the ascending channel, suggesting a potential for weakening bullish bias.
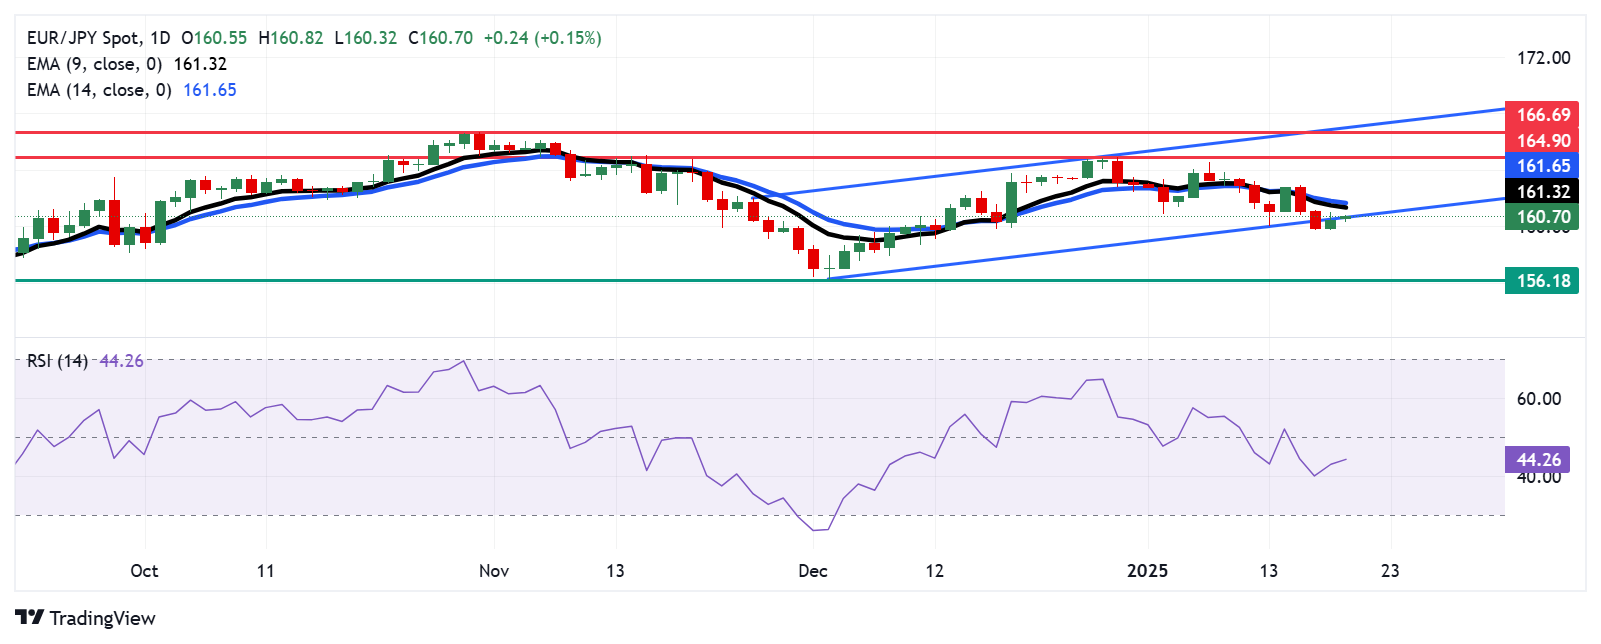
  • The bearish outlook seems possible as the 14-day RSI remains below the 50 mark.
  • The primary barrier appears at the nine-day EMA at 161.31 level.

EUR/JPY trades higher for the second successive day, hovering around 162.70 during Monday’s Asian trading session. Technical analysis of the daily chart indicates that the currency cross testing the lower boundary of the ascending channel, suggesting a potential for weakening bullish bias.

Additionally, the 14-day Relative Strength Index (RSI) remains below the 50 mark, indicating a potential bearish outlook for the EUR/JPY cross. Moreover, the currency cross's position below the nine- and 14-day Exponential Moving Averages (EMAs) highlights weakened short-term price momentum and supports the potential for further declines.

In terms of support, the EUR/JPY cross tests the ascending channel’s lower boundary at 160.50 level. A break below this channel would strengthen the bearish bias and put pressure on the currency cross to navigate the region around its four-month low of 156.18, recorded on December 3.

On the upside, the EUR/JPY cross may find its primary resistance at the nine-day EMA at 161.31 level, followed by the 14-day EMA at 161.64 level. A break above these levels would improve the short-term price momentum and support the currency cross to approach its two-month high at the 164.90 level.

A further resistance zone appears around its six-month high of 166.69, a level last seen in October 2024, followed by the psychological level at 167.00, aligned with the upper boundary of the ascending channel.

EUR/JPY: Daily Chart

Euro PRICE Today

The table below shows the percentage change of Euro (EUR) against listed major currencies today. Euro was the strongest against the US Dollar.

  USD EUR GBP JPY CAD AUD NZD CHF
USD   -0.31% -0.32% -0.20% -0.15% -0.36% -0.35% -0.01%
EUR 0.31%   -0.07% 0.00% 0.06% 0.01% -0.15% 0.17%
GBP 0.32% 0.07%   0.02% 0.12% 0.09% -0.08% 0.24%
JPY 0.20% 0.00% -0.02%   0.06% -0.11% -0.25% 0.00%
CAD 0.15% -0.06% -0.12% -0.06%   -0.15% -0.20% 0.12%
AUD 0.36% -0.01% -0.09% 0.11% 0.15%   -0.25% 0.09%
NZD 0.35% 0.15% 0.08% 0.25% 0.20% 0.25%   0.14%
CHF 0.01% -0.17% -0.24% -0.01% -0.12% -0.09% -0.14%  

The heat map shows percentage changes of major currencies against each other. The base currency is picked from the left column, while the quote currency is picked from the top row. For example, if you pick the Euro from the left column and move along the horizontal line to the US Dollar, the percentage change displayed in the box will represent EUR (base)/USD (quote).


Share: Feed news

Information on these pages contains forward-looking statements that involve risks and uncertainties. Markets and instruments profiled on this page are for informational purposes only and should not in any way come across as a recommendation to buy or sell in these assets. You should do your own thorough research before making any investment decisions. FXStreet does not in any way guarantee that this information is free from mistakes, errors, or material misstatements. It also does not guarantee that this information is of a timely nature. Investing in Open Markets involves a great deal of risk, including the loss of all or a portion of your investment, as well as emotional distress. All risks, losses and costs associated with investing, including total loss of principal, are your responsibility. The views and opinions expressed in this article are those of the authors and do not necessarily reflect the official policy or position of FXStreet nor its advertisers. The author will not be held responsible for information that is found at the end of links posted on this page.

If not otherwise explicitly mentioned in the body of the article, at the time of writing, the author has no position in any stock mentioned in this article and no business relationship with any company mentioned. The author has not received compensation for writing this article, other than from FXStreet.

FXStreet and the author do not provide personalized recommendations. The author makes no representations as to the accuracy, completeness, or suitability of this information. FXStreet and the author will not be liable for any errors, omissions or any losses, injuries or damages arising from this information and its display or use. Errors and omissions excepted.

The author and FXStreet are not registered investment advisors and nothing in this article is intended to be investment advice.

Trading Pro
Read review
Pepperstone
Read review
Trading Pro
Read review
Pepperstone
Read review

Recommended content


Recommended content

Editors’ Picks

AUD/USD: Upside appears capped at 0.6300 on Trump's tariff fallout

AUD/USD: Upside appears capped at 0.6300 on Trump's tariff fallout

AUD/USD struggles to build on the previous day's rebound and remains below the 0.6300 mark early Wednesday, anticipating US President Trump's tariffs announcement later in the day. However, buyers continue to draw support from China's stimulus optimism and RBA's prudence on the policy outlook. 

AUD/USD News
USD/JPY holds losses below 150.00 as traders await Trump's tariffs

USD/JPY holds losses below 150.00 as traders await Trump's tariffs

USD/JPY stays defensive below 150.00 in Wednesday's Asian trading as traders turn cautious ahead of Trump's reciprocal tariffs announcement. A cautious market mood and BoJ Ueda's comments underpin the Japanese Yen, keeping the pair under pressure amid a subdued US Dollar. 

USD/JPY News
Gold risks a sharp pullback if Trump’s ‘reciprocal tariffs’ disappoint

Gold risks a sharp pullback if Trump’s ‘reciprocal tariffs’ disappoint

Gold price regains traction on ‘Liberation Day’, having found fresh demand near the $3,110 region. The further upside in Gold price hinges on the highly anticipated US President Donald Trump’s “reciprocal tariffs” later this Wednesday.

Gold News
Solana traders risk $120 reversal as FTX begins $800M repayments on May 30

Solana traders risk $120 reversal as FTX begins $800M repayments on May 30

Solana’s price remained pinned below $130 on Tuesday, despite a broader market recovery. While Bitcoin, Ripple, and Cardano posted gains exceeding 3% over the past 24 hours, SOL lagged behind.

Read more
Is the US economy headed for a recession?

Is the US economy headed for a recession?

Leading economists say a recession is more likely than originally expected. With new tariffs set to be launched on April 2, investors and economists are growing more concerned about an economic slowdown or recession.

Read more
The Best brokers to trade EUR/USD

The Best brokers to trade EUR/USD

SPONSORED Discover the top brokers for trading EUR/USD in 2025. Our list features brokers with competitive spreads, fast execution, and powerful platforms. Whether you're a beginner or an expert, find the right partner to navigate the dynamic Forex market.

Read More

Forex MAJORS

Cryptocurrencies

Signatures

Best Brokers of 2025