- EUR/JPY may encounter key resistance around the psychological level of 165.00, identified as "pullback resistance."
- The 14-day Relative Strength Index remains above 50, reinforcing the bullish outlook.
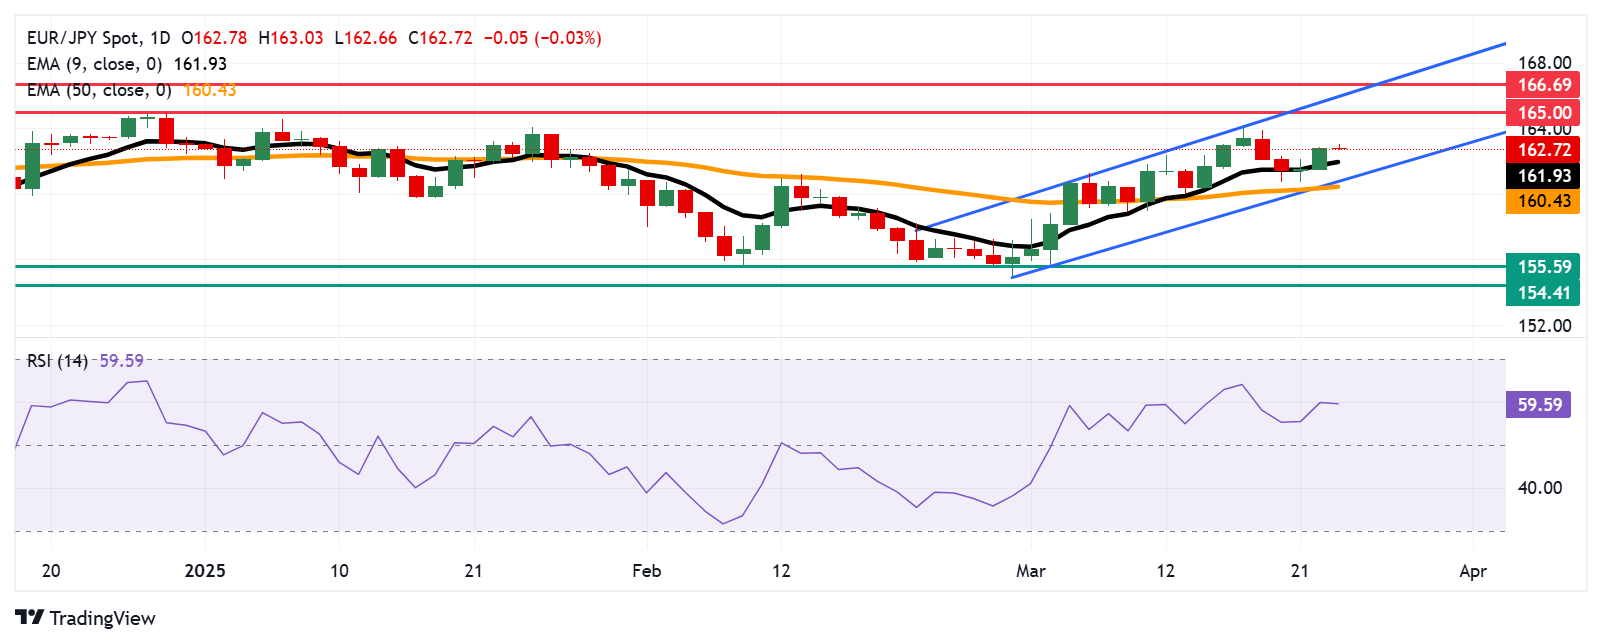
- On the downside, initial support is seen at the nine-day EMA of 161.93.
EUR/JPY holds little losses near 162.80 during Tuesday's Asian session after two consecutive days of gains. Technical analysis of the daily chart shows the currency cross trending within an ascending channel, reinforcing a bullish outlook.
Additionally, the 14-day Relative Strength Index (RSI) stays above 50, strengthening the bullish outlook for the EUR/JPY cross. The cross also holds above the nine- and 50-day Exponential Moving Averages (EMAs), highlighting strong short- and medium-term momentum and supporting the potential for further gains.
On the upside, the EUR/JPY cross may face its first key resistance around the psychological level of 165.00, marked as "pullback resistance", followed by the upper boundary of the ascending channel near 166.00. A decisive break above this critical zone could reinforce the bullish bias, potentially leading to a retest of the eight-month high at 166.69, last seen in October 2024.
The EUR/JPY cross may find initial support at the nine-day EMA of 161.93. A break below this level could weaken short-term momentum, pushing the currency cross toward the ascending channel’s lower boundary at 161.00, followed by the 50-day EMA at 160.43.
A deeper decline below this support zone could erode medium-term momentum, increasing downward pressure. This may drive the EUR/JPY cross toward its monthly low of 155.59, recorded on March 4, and potentially to 154.41, the lowest level seen since December 2023.
EUR/JPY: Daily Chart
Euro PRICE Today
The table below shows the percentage change of Euro (EUR) against listed major currencies today. Euro was the weakest against the Australian Dollar.
| USD | EUR | GBP | JPY | CAD | AUD | NZD | CHF | |
|---|---|---|---|---|---|---|---|---|
| USD | -0.03% | 0.02% | -0.03% | -0.00% | -0.09% | 0.10% | 0.02% | |
| EUR | 0.03% | 0.04% | -0.02% | 0.00% | -0.04% | 0.11% | 0.03% | |
| GBP | -0.02% | -0.04% | -0.08% | 0.00% | -0.08% | 0.07% | -0.05% | |
| JPY | 0.03% | 0.02% | 0.08% | 0.04% | 0.00% | 0.14% | 0.05% | |
| CAD | 0.00% | -0.01% | -0.00% | -0.04% | -0.04% | 0.10% | -0.02% | |
| AUD | 0.09% | 0.04% | 0.08% | -0.00% | 0.04% | 0.15% | 0.07% | |
| NZD | -0.10% | -0.11% | -0.07% | -0.14% | -0.10% | -0.15% | -0.12% | |
| CHF | -0.02% | -0.03% | 0.05% | -0.05% | 0.02% | -0.07% | 0.12% |
The heat map shows percentage changes of major currencies against each other. The base currency is picked from the left column, while the quote currency is picked from the top row. For example, if you pick the Euro from the left column and move along the horizontal line to the US Dollar, the percentage change displayed in the box will represent EUR (base)/USD (quote).
BRANDED CONTENT
The right broker can enhance your trading experience by offering key features suited to your strategy. Discover a curated list of brokers designed to meet various trading preferences.
Information on these pages contains forward-looking statements that involve risks and uncertainties. Markets and instruments profiled on this page are for informational purposes only and should not in any way come across as a recommendation to buy or sell in these assets. You should do your own thorough research before making any investment decisions. FXStreet does not in any way guarantee that this information is free from mistakes, errors, or material misstatements. It also does not guarantee that this information is of a timely nature. Investing in Open Markets involves a great deal of risk, including the loss of all or a portion of your investment, as well as emotional distress. All risks, losses and costs associated with investing, including total loss of principal, are your responsibility. The views and opinions expressed in this article are those of the authors and do not necessarily reflect the official policy or position of FXStreet nor its advertisers. The author will not be held responsible for information that is found at the end of links posted on this page.
If not otherwise explicitly mentioned in the body of the article, at the time of writing, the author has no position in any stock mentioned in this article and no business relationship with any company mentioned. The author has not received compensation for writing this article, other than from FXStreet.
FXStreet and the author do not provide personalized recommendations. The author makes no representations as to the accuracy, completeness, or suitability of this information. FXStreet and the author will not be liable for any errors, omissions or any losses, injuries or damages arising from this information and its display or use. Errors and omissions excepted.
The author and FXStreet are not registered investment advisors and nothing in this article is intended to be investment advice.


Recommended content
Editors’ Picks

AUD/USD consolidates around 0.6400; remains close to YTD top
AUD/USD holds steady around the 0.6400 mark on Friday and remains well within striking distance of the YTD peak touched earlier this week. A positive risk tone, along with the potential for a de-escalation in the US-China trade war, act as a tailwind for the Aussie amid a bank holiday in Australia and the lack of any meaningful USD buying.

USD/JPY edges higher to 143.00 mark despite strong Tokyo CPI print
USD/JPY attracts some dip-buyers following Thursday's pullback from a two-week high as hopes for an eventual US-China trade deal tempers demand for the JPY. Data released this Friday showed that core inflation in Tokyo accelerated sharply in April, bolstering bets for more rate hikes by the BoJ.

Gold eyes US-China trade talks and third straight weekly gain
Gold price holds Thursday’s rebound, defending weekly gains near $3,350 early Friday. Gold buyers catch a breather, taking stock of the trade developments globally after US President Donald Trump’s tariffs whiplash.

TON Foundation appoints new CEO after $400M investment: Will Toncoin price reach $5 in 2025?
TON Foundation has appointed Maximilian Crown, co-founder of MoonPay, as its new CEO. Toncoin price remained muted, consolidating with a tight 2% range between $3.08 and $3.21 on Thursday.

Five fundamentals for the week: Traders confront the trade war, important surveys, key Fed speech Premium
Will the US strike a trade deal with Japan? That would be positive progress. However, recent developments are not that positive, and there's only one certainty: headlines will dominate markets. Fresh US economic data is also of interest.

The Best brokers to trade EUR/USD
SPONSORED Discover the top brokers for trading EUR/USD in 2025. Our list features brokers with competitive spreads, fast execution, and powerful platforms. Whether you're a beginner or an expert, find the right partner to navigate the dynamic Forex market.