|

EUR/JPY Price Analysis: Uptrend stalls at 159.00, as buyers target 159.70s YTD high

  • EUR/JPY climbs for the second straight day, breaking above 158.92, but closes at 158.74.
  • BoJ's ultra-loose monetary policy pressures JPY, while positive EU data reduces a possible ECB rate hike.
  • Technical analysis shows potential for further gains, with YTD high at 159.76 as next target for buyers.

EUR/JPY climbed for the second straight day, breaking above last Thursday’s high of 158.92, though it retreated some and printed a daily close of 158.74, registering gains of 0.19%.

The fundamental backdrop has not changed, as risk aversion was the price action driver during the week, while the Bank of Japan’s (BoJ) commitment to its ultra-loose monetary policy pressured the Japanese Yen (JPY). Meanwhile, the Eurozone’s (EU) more positive economic data has pushed aside the likelihood of a European Central Bank (ECB) rate hike, but the Euro (EUR) is not out of the woods yet. Recessionary fears loom, along with inflation twice the ECB’s target, increased speculations for a stagflationary scenario.

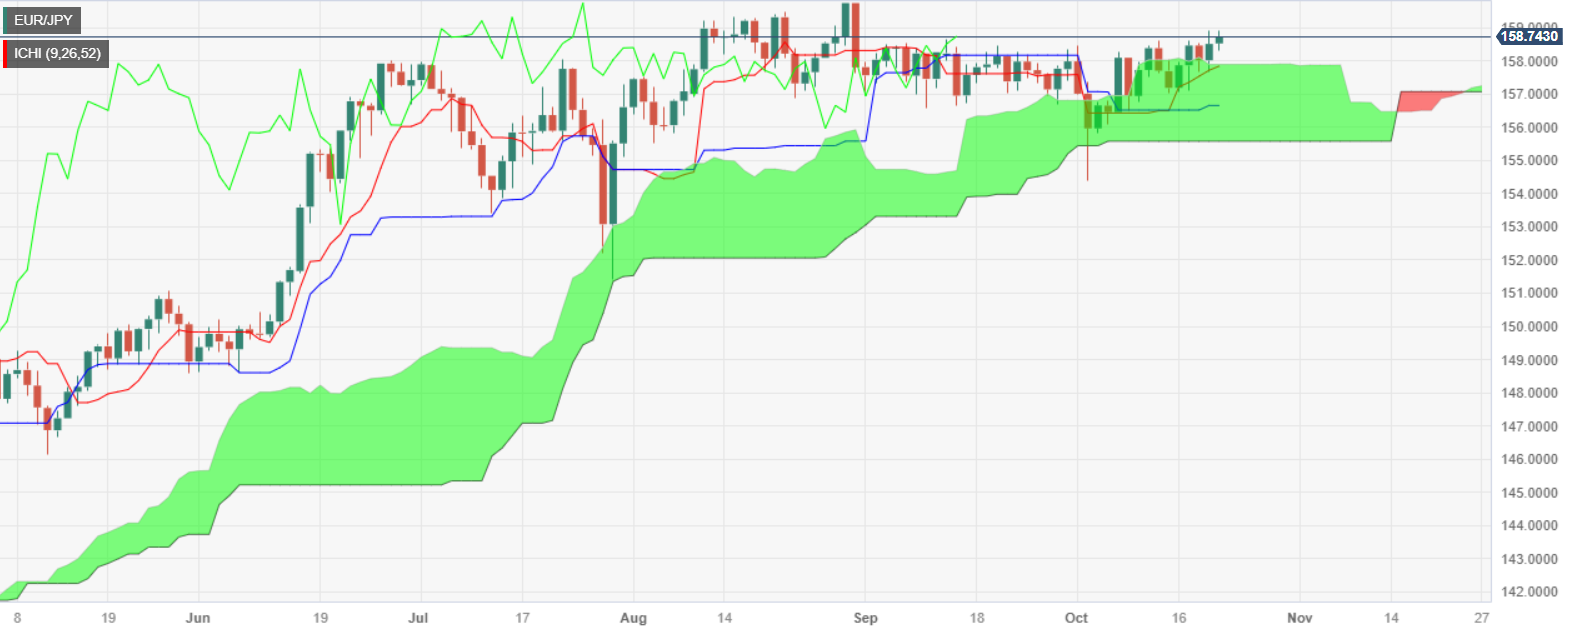
From a technical perspective, the EUR/JPY’s lack of clear direction keeps the pair trading sideways, though slightly tilted to the upside. If the cross-pair breaks above 159.00, buyers could test the year-to-date (YTD) high at 159.76.

Conversely, if EUR/JPY sellers moved in, the first support would be the 158.00 figure, immediately followed by the top of the Ichimoku Cloud (Kumo) at 157.75/95. Once cleared, the cross would drip inside the Kumo, indicating sellers gathering momentum, with the next support seen at the Tenkan Sen at 157.85, followed by the Kijun-Sen at 156.64.

EUR/JPY Price Action – Daily chart

EUR/JPY Technical Levels

EUR/JPY

Overview
Today last price158.74
Today Daily Change0.23
Today Daily Change %0.15
Today daily open158.51
 
Trends
Daily SMA20157.56
Daily SMA50157.93
Daily SMA100156.54
Daily SMA200150.63
 
Levels
Previous Daily High158.93
Previous Daily Low157.68
Previous Weekly High158.61
Previous Weekly Low156.51
Previous Monthly High158.66
Previous Monthly Low156.58
Daily Fibonacci 38.2%158.45
Daily Fibonacci 61.8%158.16
Daily Pivot Point S1157.82
Daily Pivot Point S2157.13
Daily Pivot Point S3156.57
Daily Pivot Point R1159.07
Daily Pivot Point R2159.63
Daily Pivot Point R3160.32

Author

Christian Borjon Valencia

Christian Borjon began his career as a retail trader in 2010, mainly focused on technical analysis and strategies around it. He started as a swing trader, as he used to work in another industry unrelated to the financial markets.

More from Christian Borjon Valencia
Share:

Markets move fast. We move first.

Orange Juice Newsletter brings you expert driven insights - not headlines. Every day on your inbox.

By subscribing you agree to our Terms and conditions.

Editor's Picks

EUR/USD clings to small gains near 1.1750

Following a short-lasting correction in the early European session, EUR/USD regains its traction and clings to moderate gains at around 1.1750 on Monday. Nevertheless, the pair's volatility remains low, with investors awaiting this weeks key data releases from the US and the ECB policy announcements.

GBP/USD edges higher toward 1.3400 ahead of US data and BoE

GBP/USD reverses its direction and advances toward 1.3400 following a drop to the 1.3350 area earlier in the day. The US Dollar struggles to gather recovery momentum as markets await Tuesday's Nonfarm Payrolls data, while the Pound Sterling holds steady ahead of the BoE policy announcements later in the week.

Gold stuck around $4,300 as markets turn cautious

Gold loses its bullish momentum and retreats below $4,350 after testing this level earlier on Monday. XAU/USD, however, stays in positive territory as the US Dollar remains on the back foot on growing expectations for a dovish Fed policy outlook next year.

Solana consolidates as spot ETF inflows near $1 billion signal institutional dip-buying

Solana price hovers above $131 at the time of writing on Monday, nearing the upper boundary of a falling wedge pattern, awaiting a decisive breakout. On the institutional side, demand for spot Solana Exchange-Traded Funds remained firm, pushing total assets under management to nearly $1 billion since launch. 

Big week ends with big doubts

The S&P 500 continued to push higher yesterday as the US 2-year yield wavered around the 3.50% mark following a Federal Reserve (Fed) rate cut earlier this week that was ultimately perceived as not that hawkish after all. The cut is especially boosting the non-tech pockets of the market.

Solana Price Forecast: SOL consolidates as spot ETF inflows near $1 billion signal institutional dip-buying

Solana (SOL) price hovers above $131 at the time of writing on Monday, nearing the upper boundary of a falling wedge pattern, awaiting a decisive breakout.