|

EUR/JPY Price Analysis: Trapped within EMAs, the short-term outlook looks sideways

  • EUR/JPY turns bullish as it forms a double bottom and a bullish engulfing candle pattern.
  • Short term, the EUR/JPY is neutrally biased, trapped within the EMAs.
  • EUR/JPY Price Analysis: Bullish above 142.00; otherwise would turn downwards.

EUR/JPY rallied sharply on Monday and formed a bullish engulfing candle chart pattern. A double bottom takes shape as the EUR/JPY is poised to test solid resistance at around the 142.29-47 area. At the time of writing, the EUR/JPY is trading at 142.03.

EUR/JPY Price action

The EUR/JPY daily chart is neutral to upward biased. Nevertheless, the last few days’ price action has opened the door for further gains. Oscillators are mixed, with the Relative Strength Index (RSI) flat at bearish territory, while the Rate of Change (RoC) jumped on Monday’s trading session. Therefore, mixed signals could keep EUR/JPY traders at bay.

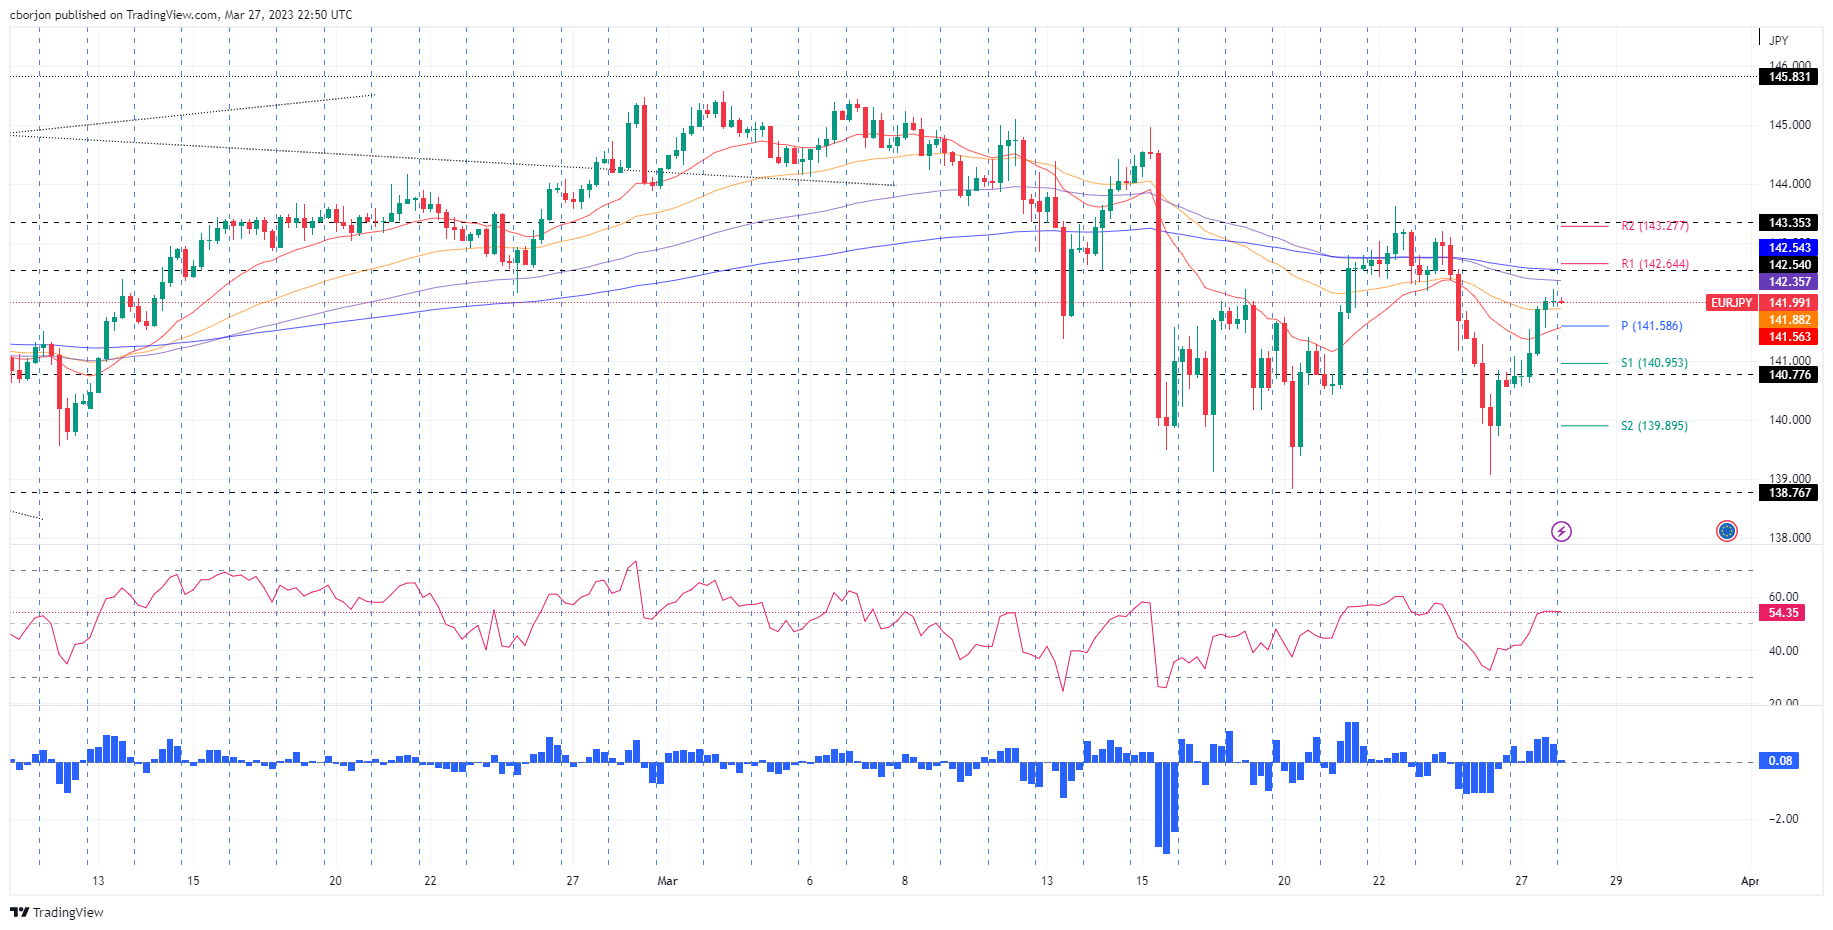
Short term, the EUR/JPY climb is pausing nearby the 142.00 mark. The EUR/JPY drew a doji, indicating that buyers/sellers are at equilibrium while oscillators remain bullish. The Relative Strength Index (RSI) at 54 turned flat, while the Rate of Change (RoC) was neutral. Therefore, the EUR/JPY might trade sideways before resuming upwards or downwards.

If the EUR/JPY cracks the 142.00 figure, the pair will test the 100-EMA at 142.35. A breach of the latter will expose the 142.54 as the pair sets to test the 143.00 mark.

On the flip side, the EUR/JPY first support would be the 50-EMA at 141.88. Once cleared, the pair would tumble to the confluence of the 20-EMA and the pivot point at 141.58 before testing 141.00.

EUR/JPY 4-hour chart

EUR/JPY 4-hour chart

EUR/JPY Technical levels

EUR/JPY

Overview
Today last price141.99
Today Daily Change1.35
Today Daily Change %0.96
Today daily open140.64
 
Trends
Daily SMA20143.22
Daily SMA50142.24
Daily SMA100142.66
Daily SMA200141.84
 
Levels
Previous Daily High141.85
Previous Daily Low139.07
Previous Weekly High143.63
Previous Weekly Low138.83
Previous Monthly High145.47
Previous Monthly Low139.55
Daily Fibonacci 38.2%140.13
Daily Fibonacci 61.8%140.79
Daily Pivot Point S1139.19
Daily Pivot Point S2137.74
Daily Pivot Point S3136.41
Daily Pivot Point R1141.97
Daily Pivot Point R2143.3
Daily Pivot Point R3144.74

Author

Christian Borjon Valencia

Christian Borjon began his career as a retail trader in 2010, mainly focused on technical analysis and strategies around it. He started as a swing trader, as he used to work in another industry unrelated to the financial markets.

More from Christian Borjon Valencia
Share:

Markets move fast. We move first.

Orange Juice Newsletter brings you expert driven insights - not headlines. Every day on your inbox.

By subscribing you agree to our Terms and conditions.

Editor's Picks

EUR/USD struggles to extend advance above 1.1800

The EUR/USD pair posts a fresh weekly low near 1.1740 during the Asian trading session on Wednesday. The major currency pair is under pressure as the US Dollar edges higher despite Federal Open Market Committee minutes of the December policy meeting, released on Tuesday, showing that most policymakers stressed the need for further interest rate cuts.

GBP/USD tests 1.3450 support after moving below nine-day EMA

GBP/USD remains subdued for the second consecutive day, trading around 1.3460 during the Asian hours on Wednesday. The technical analysis of the daily chart indicates a weakening of a bullish bias as the pair is positioned slightly below the lower boundary of the ascending channel pattern.

Gold jumps on US rate cut prospects, safe-haven demand

Gold price extends the rally above $4,350 during the early European trading hours on Wednesday. Gold's price has surged about 65% this year and is set to record its biggest annual gains since 1979. The rally in the precious metal is bolstered by the prospect of further US interest rate cuts in 2026. Lower interest rates could reduce the opportunity cost of holding Gold, supporting the non-yielding precious metal.

Bitcoin, Ethereum and XRP prepare for a potential New Year rebound

Bitcoin, Ethereum, and Ripple are holding steady on Wednesday after recording minor gains on the previous day. Technically, Bitcoin could extend gains within a triangle pattern while Ethereum and Ripple face critical overhead resistance. 

Economic outlook 2026-2027 in advanced countries: Solidity test

After a year marked by global economic resilience and ending on a note of optimism, 2026 looks promising and could be a year of solid economic performance. In our baseline scenario, we expect most of the supportive factors at work in 2025 to continue to play a role in 2026.

Crypto market outlook for 2026

Year 2025 was volatile, as crypto often is.  Among positive catalysts were favourable regulatory changes in the U.S., rise of Digital Asset Treasuries (DAT), adoption of AI and tokenization of Real-World-Assets (RWA).