- EUR/JPY trades on a stronger note near 169.75 in Thursday’s early European session, gaining 0.22% on the day.
- The cross maintains a positive stance above the key 100-period EMA, with a bullish RSI indicator.
- The first upside barrier is seen at the 170.00 psychological mark; the initial support level is seen at 169.32.
The EUR/JPY cross gathers strength around 169.75 during the early European session on Thursday. The uncertainty that the Bank of Japan (BoJ) will announce a reduction in monthly government bond purchases amid a weaker economy continues to undermine the Japanese Yen (JPY) and create a tailwind for EUR/JPY. Market players await the Bank of Japan (BoJ) monetary policy meeting on Friday, which is widely expected to leave interest rates unchanged.
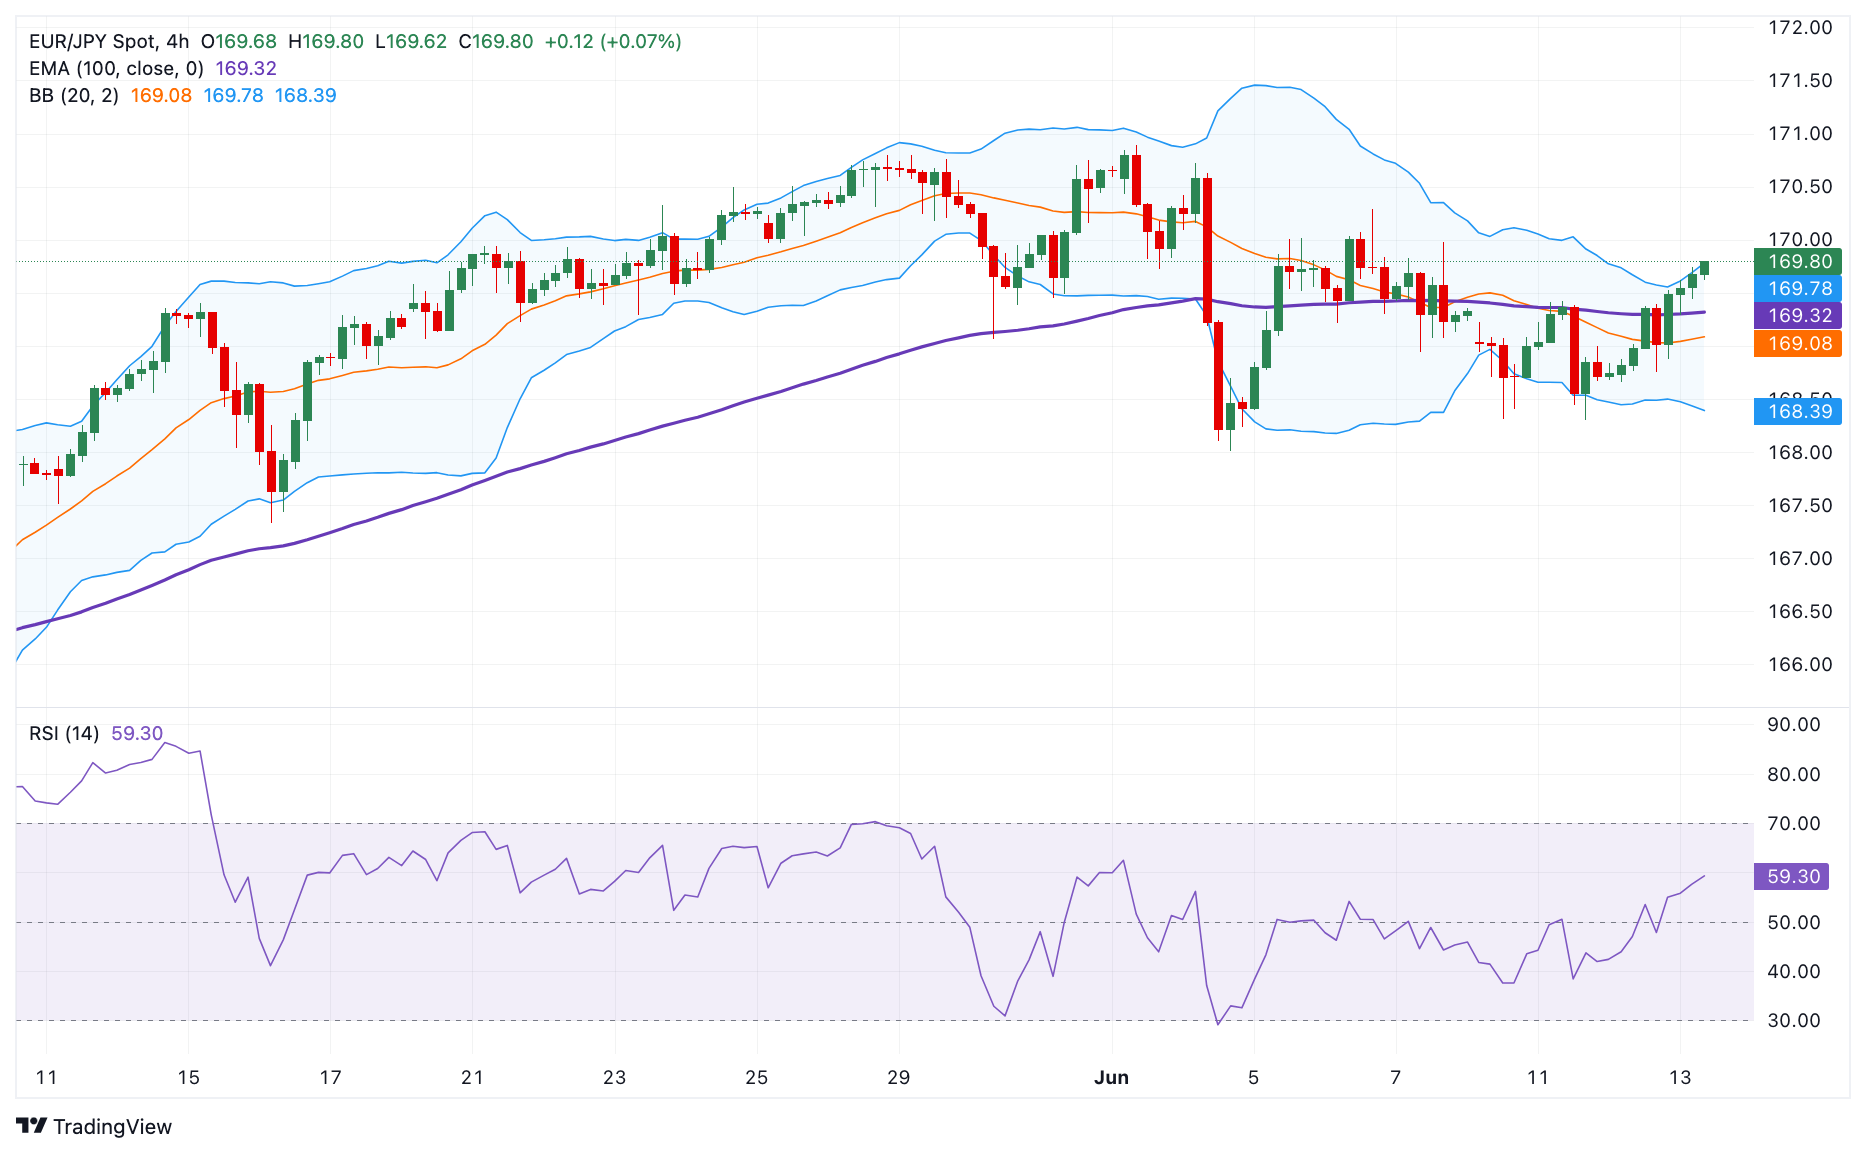
According to the 4-hour chart, EUR/JPY keeps the bullish vibe unchanged as the cross is above the key 100-period Exponential Moving Averages (EMA). The upward momentum is supported by the Relative Strength Index (RSI), which stands in bullish territory near 58.0, supporting the buyers for the time being.
A decisive break above 169.75, the upper boundary of Bollinger Band, will attract some buyers to the 170.00 psychological level. Further north, the additional upside filter to watch is 170.85, a high of June 3, en route to an all-time high of 171.60.
On the downside, the initial support level is located at 169.32, the 100-period EMA. A breach of the mentioned level could pave the way to 168.75, a low of June 12. Extended losses will see a drop to 168.40, the lower limit of Bollinger Band.
EUR/JPY 4-hour chart
Information on these pages contains forward-looking statements that involve risks and uncertainties. Markets and instruments profiled on this page are for informational purposes only and should not in any way come across as a recommendation to buy or sell in these assets. You should do your own thorough research before making any investment decisions. FXStreet does not in any way guarantee that this information is free from mistakes, errors, or material misstatements. It also does not guarantee that this information is of a timely nature. Investing in Open Markets involves a great deal of risk, including the loss of all or a portion of your investment, as well as emotional distress. All risks, losses and costs associated with investing, including total loss of principal, are your responsibility. The views and opinions expressed in this article are those of the authors and do not necessarily reflect the official policy or position of FXStreet nor its advertisers. The author will not be held responsible for information that is found at the end of links posted on this page.
If not otherwise explicitly mentioned in the body of the article, at the time of writing, the author has no position in any stock mentioned in this article and no business relationship with any company mentioned. The author has not received compensation for writing this article, other than from FXStreet.
FXStreet and the author do not provide personalized recommendations. The author makes no representations as to the accuracy, completeness, or suitability of this information. FXStreet and the author will not be liable for any errors, omissions or any losses, injuries or damages arising from this information and its display or use. Errors and omissions excepted.
The author and FXStreet are not registered investment advisors and nothing in this article is intended to be investment advice.


Recommended content
Editors’ Picks

Gold hovers around all-time highs near $3,250
Gold is holding steady near the $3,250 mark, fuelled by robust safe-haven demand, trade war concerns, and a softer-than-expected US inflation gauge. The US Dollar keeps trading with heavy losses around three-year lows.

EUR/USD retreats towards 1.1300 as Wall Street shrugs off trade war headlines
The EUR/USD pair retreated further from its recent multi-month peak at 1.1473 and trades around the 1.1300 mark. Wall Street manages to advance ahead of the weekly close, despite escalating tensions between Washington and Beijing and mounting fears of a US recession. Profit-taking ahead of the close also weighs on the pair.

GBP/USD trims gains, recedes to the 1.3050 zone
GBP/USD now gives away part of the earlier advance to fresh highs near 1.3150. Meanwhile, the US Dollar remains offered amid escalating China-US trade tensions, recession fears in the US, and softer-than-expected US Producer Price data.

Bitcoin, Ethereum, Dogecoin and Cardano stabilze – Why crypto is in limbo
Bitcoin, Ethereum, Dogecoin and Cardano stabilize on Friday as crypto market capitalization steadies around $2.69 trillion. Crypto traders are recovering from the swing in token prices and the Monday bloodbath.

Is a recession looming?
Wall Street skyrockets after Trump announces tariff delay. But gains remain limited as Trade War with China continues. Recession odds have eased, but investors remain fearful. The worst may not be over, deeper market wounds still possible.

The Best brokers to trade EUR/USD
SPONSORED Discover the top brokers for trading EUR/USD in 2025. Our list features brokers with competitive spreads, fast execution, and powerful platforms. Whether you're a beginner or an expert, find the right partner to navigate the dynamic Forex market.