|

EUR/JPY Price Analysis: Test of multi-day support line near 142.00 looms

  • EUR/JPY takes offers to refresh intraday low, extends pullback from 21-DMA.
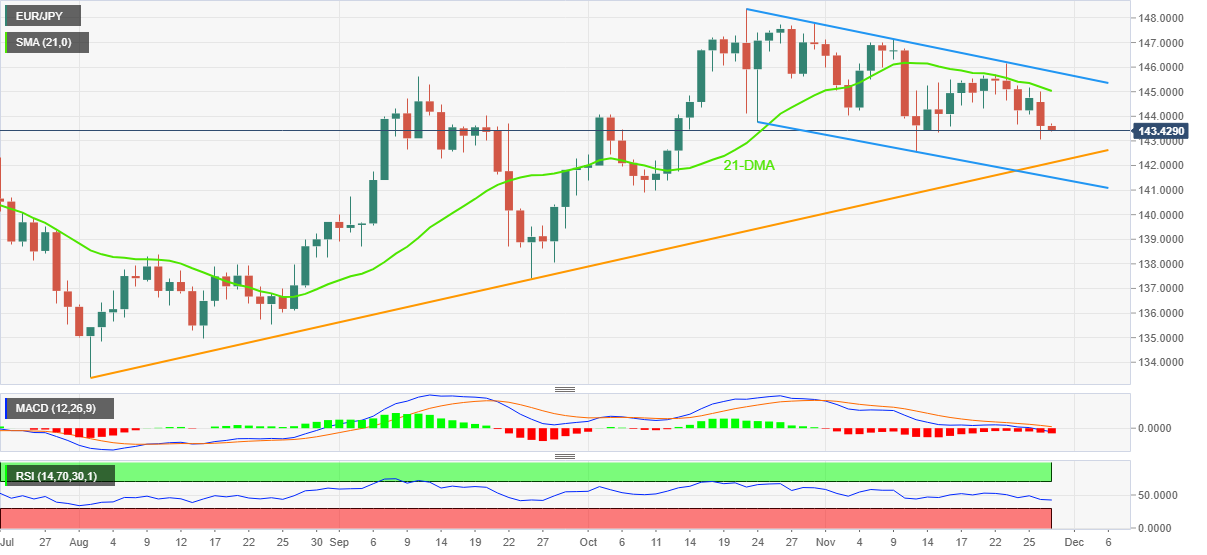
  • Bearish MACD signals, downbeat RSI also favors sellers targeting ascending trend line from early August.
  • Monthly bearish channel keeps the downside bias intact.

EUR/JPY renews its intraday low around 143.30 while extending the week-start fall during early Tuesday.

In doing so, the cross-currency pair also justifies the sustained trading below the 21-DMA and downbeat MACD signals, as well as softer RSI (14), to keep the bears hopeful inside a one-month-old bearish channel.

That said, an upward-sloping support line from early August, around 142.10 by the press time, appears imminent support for the EUR/JPY bears to watch.

Following that, the stated descending channel’s lower line, close to 141.50, will be in focus.

Alternatively, the 21-DMA hurdle surrounding 145.00 could challenge the short-term recovery of the EUR/JPY pair ahead of highlighting the bearish channel’s upper line, close to 145.85 at the latest.

In a case where the pair buyers manage to cross the 145.85 hurdle, the 146.00 round figure may act as an intermediate halt during the run-up towards the previous monthly top of 148.40.

Overall, EUR/JPY is likely to remain weak inside a short-term bearish chart formation while a multi-day-old support line lures the downside momentum of late. It should be noted, however, that, the 141.50 is the key support to watch before ruling out the odds of the pair’s rebound.

EUR/JPY: Daily chart

Trend: Further downside expected

Additional important levels

Overview
Today last price143.44
Today Daily Change-0.17
Today Daily Change %-0.12%
Today daily open143.61
 
Trends
Daily SMA20145.11
Daily SMA50144.2
Daily SMA100141.61
Daily SMA200138.87
 
Levels
Previous Daily High145.01
Previous Daily Low143.05
Previous Weekly High146.14
Previous Weekly Low143.65
Previous Monthly High148.4
Previous Monthly Low140.9
Daily Fibonacci 38.2%143.8
Daily Fibonacci 61.8%144.26
Daily Pivot Point S1142.77
Daily Pivot Point S2141.93
Daily Pivot Point S3140.81
Daily Pivot Point R1144.73
Daily Pivot Point R2145.85
Daily Pivot Point R3146.69

Author

Anil Panchal

Anil Panchal

FXStreet

Anil Panchal has nearly 15 years of experience in tracking financial markets. With a keen interest in macroeconomics, Anil aptly tracks global news/updates and stays well-informed about the global financial moves and their implications.

More from Anil Panchal
Share:

Editor's Picks

EUR/USD rebounds from session lows, stays below 1.1650

EUR/USD is recovers modestly from session lows but remains in the red below 1.1650 in European trading on Thursday. The pair faces headwinds from a renewed uptick in the US Dollar amid a negative shift in risk sentiment. Surging energy prices due to the Middle East war keep the bearish pressure intact on the Euro. The US Jobless Claims data are next of note. 

GBP/USD stays weak near 1.3350 amid UK stagflation risks

GBP/USD sticks to losses near 1.3350 in the European session on Thursday. The Pound Sterling loses ground amid fears that the United Kingdom economy could face stagflation risks due to higher energy prices, while the US Dollar attracts fresh havem demand ahead of the US Jobless Claims data. 

Gold climbs near $5,200 as Iran war fuels safe-haven demand

Gold price extends its gains for the second successive session on Thursday as traders seek safety amid the ongoing war in the Middle East. US and Israeli strikes across Iranian territory and widespread Iranian missile and drone retaliation across the Middle East, including attacks on regional targets and military sites, prolong the crisis and its impact.

Three reasons to be bearish on Bitcoin

Bitcoin is holding up well taking into account the uncertainty stemming from the Middle East. Despite this week’s rally, the long-term outlook remains bearish. Here are three reasons why I think the storm for the largest cryptocurrency isn't over yet.

Markets attempt to rally on positive news from Iran

There’s been an abrupt change in sentiment this morning, European stock markets are higher and oil and gas prices are moderating, after comments from Iran’s deputy minister about pre-conflict talks between Iran and the US.

Cardano Price Analysis: Approaches key trendline amid bearish sentiment

Cardano (ADA) price is approaching its descending trendline around $0.28 at the time of writing, set to shape the next directional move. The derivatives metrics paint a bearish picture, with ADA’s Open Interest continuing to fall and short bets rising among traders.