EUR/JPY Price Analysis: Technical correction has further legs to go


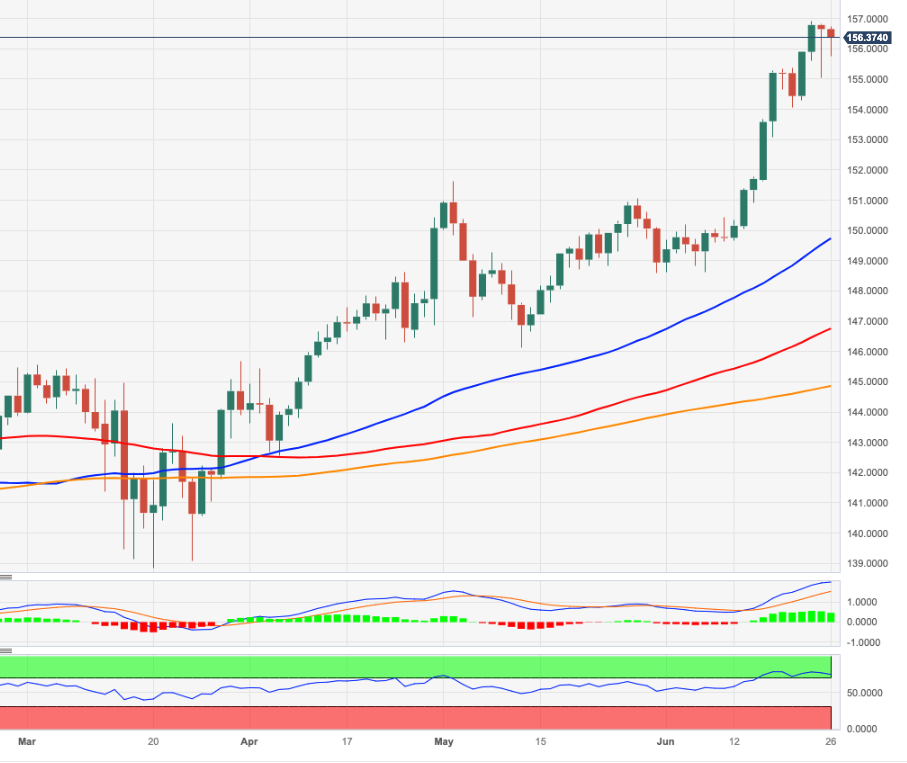
  • EUR/JPY adds to Friday’s pullback around 156.40.
  • Further upside could target the weekly top past 163.00.

EUR/JPY faces some renewed downside pressure and retreats from recent multi-year peaks in levels just shy of the 157.00 barrier.

In the meantime, further gains appear on the cards, while a clear breakout of the 2023 high at 156.93 (June 22) should meet the next relevant hurdle not before the weekly high of 163.09 (August 22 2008).

The ongoing overbought conditions of the cross, however, are indicative that a deeper knee-jerk should not be ruled out at some point in the short-term horizon.

So far, further upside looks favoured while the cross trades above the 200-day SMA, today at 144.82.

EUR/JPY daily chart

EUR/JPY

Overview
Today last price 156.38
Today Daily Change 98
Today Daily Change % -0.17
Today daily open 156.65
 
Trends
Daily SMA20 151.89
Daily SMA50 149.87
Daily SMA100 146.62
Daily SMA200 144.8
 
Levels
Previous Daily High 156.83
Previous Daily Low 155.06
Previous Weekly High 156.93
Previous Weekly Low 154.05
Previous Monthly High 151.62
Previous Monthly Low 146.14
Daily Fibonacci 38.2% 155.73
Daily Fibonacci 61.8% 156.15
Daily Pivot Point S1 155.53
Daily Pivot Point S2 154.41
Daily Pivot Point S3 153.76
Daily Pivot Point R1 157.3
Daily Pivot Point R2 157.95
Daily Pivot Point R3 159.07


Share: Feed news

Information on these pages contains forward-looking statements that involve risks and uncertainties. Markets and instruments profiled on this page are for informational purposes only and should not in any way come across as a recommendation to buy or sell in these assets. You should do your own thorough research before making any investment decisions. FXStreet does not in any way guarantee that this information is free from mistakes, errors, or material misstatements. It also does not guarantee that this information is of a timely nature. Investing in Open Markets involves a great deal of risk, including the loss of all or a portion of your investment, as well as emotional distress. All risks, losses and costs associated with investing, including total loss of principal, are your responsibility. The views and opinions expressed in this article are those of the authors and do not necessarily reflect the official policy or position of FXStreet nor its advertisers. The author will not be held responsible for information that is found at the end of links posted on this page.

If not otherwise explicitly mentioned in the body of the article, at the time of writing, the author has no position in any stock mentioned in this article and no business relationship with any company mentioned. The author has not received compensation for writing this article, other than from FXStreet.

FXStreet and the author do not provide personalized recommendations. The author makes no representations as to the accuracy, completeness, or suitability of this information. FXStreet and the author will not be liable for any errors, omissions or any losses, injuries or damages arising from this information and its display or use. Errors and omissions excepted.

The author and FXStreet are not registered investment advisors and nothing in this article is intended to be investment advice.

Recommended content


Recommended content

Editors’ Picks

AUD/USD finally broke above 0.6700… will it last?

AUD/USD finally broke above 0.6700… will it last?

AUD/USD added to Tuesday’s advance and rose markedly in a context favourable to the risk-associated space following the sharp data-driven sell-off in the Greenback, while auspicious results from the domestic calendar also lent legs to AUD.

AUD/USD News

EUR/USD: Bullish outlook expected above the 200-day SMA

EUR/USD: Bullish outlook expected above the 200-day SMA

EUR/USD extended its multi-session recovery north of 1.0800 the figure following the persistent retracement in the US Dollar and against the backdrop of steady expectation ahead of the second round of French elections on July 7.

EUR/USD News

Gold reaches $2,360 on broad USD weakness

Gold reaches $2,360 on broad USD weakness

Gold gathers bullish momentum and trades at its highest level in nearly two weeks above $2,360. Following the disappointing ADP Employment Change and ISM Services PMI data from the US, the 10-year US yield declines sharply, helping XAU/USD extend its daily rally.

Gold News

Ripple legal battle underway as on-chain metrics turn bullish, XRP eyes recovery to $0.50

Ripple legal battle underway as on-chain metrics turn bullish, XRP eyes recovery to $0.50

Ripple made a comeback above $0.48 on Tuesday and hovers above that level in Wednesday’s European session. Ripple on-chain metrics such as transaction volume and Network Realized Profit/Loss (NPL) have turned bullish, supporting a recovery in the altcoin. 

Read more

Disinflation in the United States: The scale of the sacrifice on the labour market

Disinflation in the United States: The scale of the sacrifice on the labour market

Since a 1977 act, the dual mandate of the Federal Reserve (Fed) has de jure entrusted it with the objectives of maximum employment and price stability (the latter being expected to favour the former in the long term).

Read more

Forex MAJORS

Cryptocurrencies

Signatures