|

EUR/JPY Price Analysis: Subdued around 143.40s, as bulls prepare for an assault to 145.00

  • The EUR/JPY is registering gains of 2.22% in the week after facing solid resistance around 143.60.
  • EUR/JPY Price Analysis: In consolidation within a 130 pip range circa the 143.00 psychological barriers.

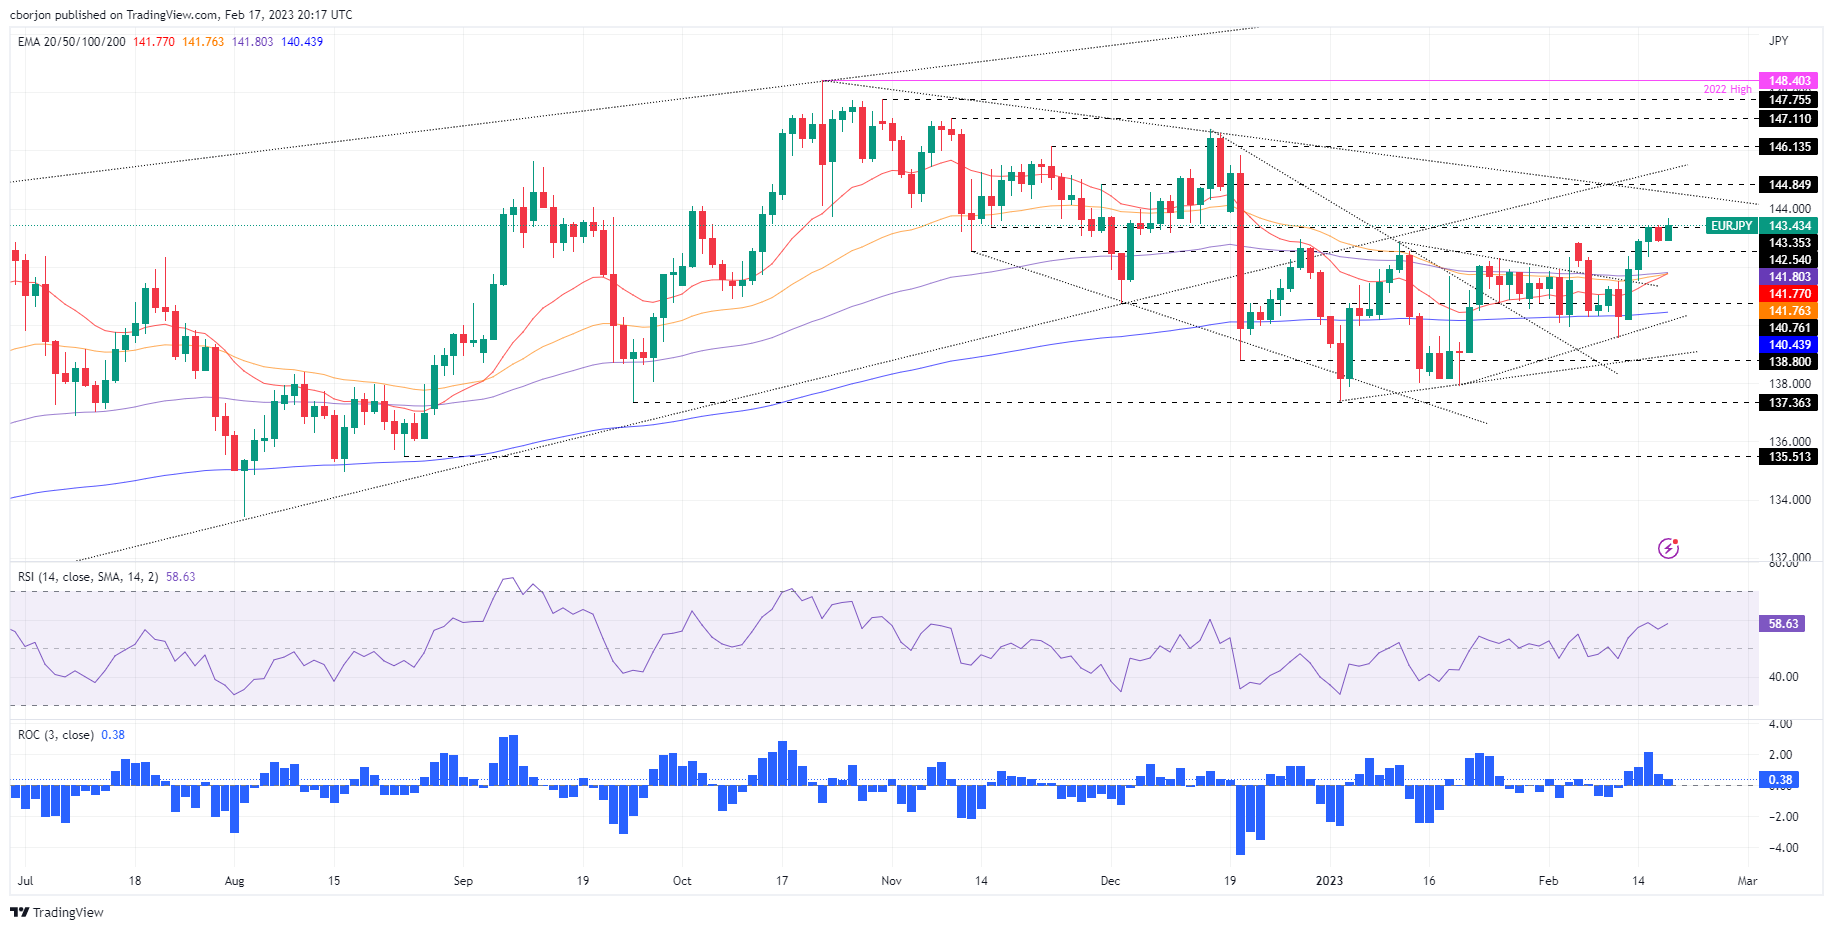
The EUR/JPY hit a fresh weekly high at 143.67 but reversed some of those gains, resting comfortably above Thursday’s high ahead of the weekend. Therefore, the EUR/JPY exchanges hands at 143.40 after dropping to a low of 142.91.

EUR/JPY began the week at around the 200-day Exponential Moving Average (EMA) at 140.32 before rallying sharply towards the 142.38 Tuesday high. Since that day, the EUR/JPY consolidated at around the 142.35-143.65 area, unable to crack either side of the range.

On Friday, the EUR/JPY pierced the top of the range, but buyers unable to hold to its gains, caused a retracement in the pair. Therefore, the EUR/JPY neutral-to-upward bias remains intact.

If the EUR/JPY breaks the top of the range, the next supply area will be 144.00. Once broken, the EUR/JPY might rally and test a five-month-old downslope resistance trendline passing nearby 144.50/60. That could propel EUR/JPY bulls toward the psychological 145.00 barrier.

Contrarily a EUR/JPY fall below 142.30, and the pair might test the 142.00 figure. A breach of the latter will open the door for a move lower to the 141.70/80 area, with the 20, 50, and 100-day EMAs resting inside the range, followed by a fall to the 200*day EMA at 140.44.

EUR/JPY Daily chart

EUR/JPY Key technical levels

EUR/JPY

Overview
Today last price143.48
Today Daily Change0.59
Today Daily Change %0.41
Today daily open142.89
 
Trends
Daily SMA20141.58
Daily SMA50141.5
Daily SMA100143.06
Daily SMA200141.21
 
Levels
Previous Daily High143.44
Previous Daily Low142.88
Previous Weekly High142.88
Previous Weekly Low139.55
Previous Monthly High142.86
Previous Monthly Low137.39
Daily Fibonacci 38.2%143.09
Daily Fibonacci 61.8%143.23
Daily Pivot Point S1142.69
Daily Pivot Point S2142.5
Daily Pivot Point S3142.13
Daily Pivot Point R1143.26
Daily Pivot Point R2143.64
Daily Pivot Point R3143.83

Author

Christian Borjon Valencia

Markets analyst, news editor, and trading instructor with over 14 years of experience across FX, commodities, US equity indices, and global macro markets.

More from Christian Borjon Valencia
Share:

Editor's Picks

EUR/USD appears supported by the 200-day SMA, for now

Following an early pullback to multi-week lows near 1.1670, EUR/USD now manages to reclaim the 1.1700 region as the NA session draws to a close on Monday. The steep retracement in spot follows the equally strong move higher in the US Dollar, as investors continue to assess the geopolitical landscape in the wake of the US and Israel attacks on Iran.


GBP/USD hits new yearly lows near 1.3300

GBP/USD adds to the recent bearish tone, approaching to the key 1.3300 support to reach fresh YTD troughs against the backdrop of the robust performance of the US Dollar. Indeed, Cable’s decline comes amid the firm demand for the safe-haven space in the wake of the US and Israel attacks to Iran.

Gold clings to gains as US-Iran conflict continues to underpin safe-haven assets

Gold retains positive bias for the fifth consecutive day on Tuesday as rising geopolitical tensions in the Middle East continue to underpin safe-haven assets. However, a bullish US Dollar could keep the bullion below its highest level since late January, set on Monday, warranting caution before positioning for any further appreciation.

Strategy lifts holdings to 3.4% of Bitcoin's total supply amid inflows into crypto products

Strategy continued its accumulation of the top crypto last week, acquiring 3,015 BTC for $204 million amid renewed interest in crypto products after four weeks of outflows.

The Fed is finally talking about AI – Here's why it matters for the US Dollar

AI is moving from earnings calls into the heart of monetary policy discussions, forcing Federal Reserve officials to confront a new question: How to act if AI reshapes inflation, employment and interest rates at the same time?

Grass 20% bullish breakout defies broader market weakness

Grass (GRASS) is edging up above $0.30 at the time of writing on Monday. The token’s notable 20% intraday surge stands out amid heightened volatility in the broader crypto market.