|

EUR/JPY Price Analysis: Struggles at 130.00, bears attack the 129.00 region

  • EUR/JPY is flat as the Asian Pacific session begins, near Wednesday’s low around the 129.20s.
  • EUR/JPY: Broke below a descending channel, accelerating the downtrend towards 129.00.
  • EUR/JPY: A break below 129.00 could pave the way for a deeper correction, firstly 128.00, followed by 126.00.

The EUR/JPY is subdued as the Asian session begins, trading flat at 129.21 during the day at the time of writing.

On Wednesday, during the overnight session, the shared currency failed to break above the 50-hour simple moving average (HSMA). It also broke below the bottom-trendline of a descending channel, accelerating the downtrend, dropping 100 pips throughout the day, reaching a low around the 129.00 flat.

EUR/JPY Price Analysis: Technical outlook

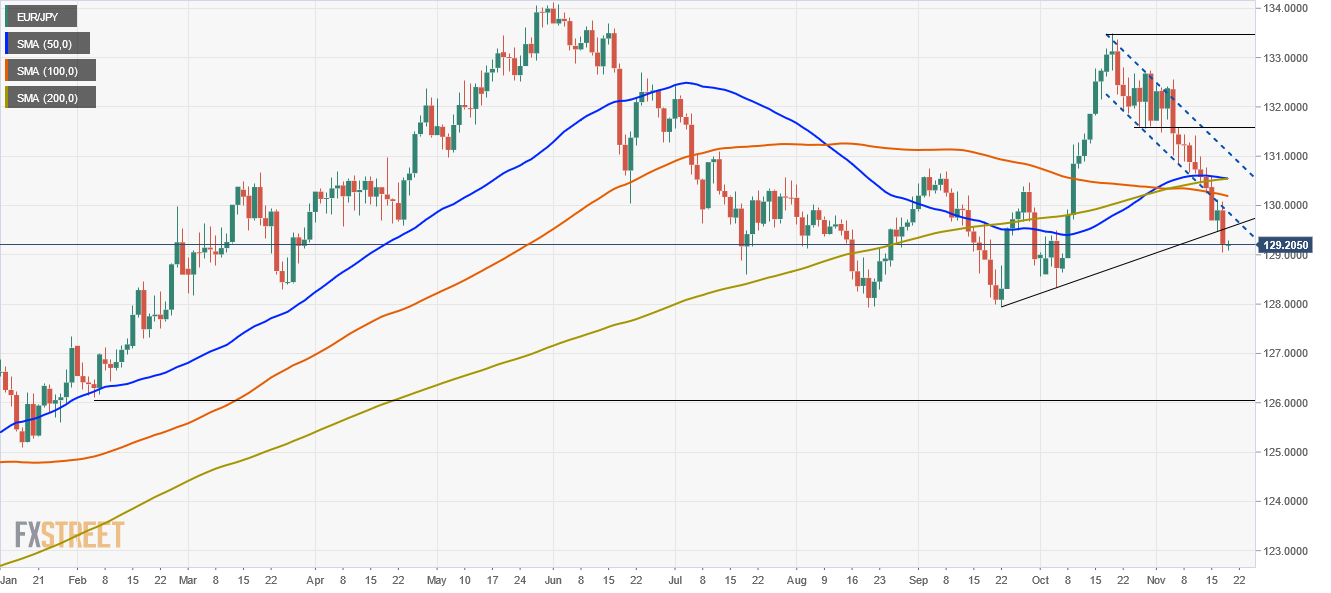
The daily chart depicts that the EUR/JPY pair broke below the descending channel, which seemed to be a bullish flag. However, once the spot price broke the bottom-trendline, it negated the validity of the pattern. Additionally, it broke a four-week upward trendline, cementing the downward bias in the pair.

Further, the 50-day moving average (DMA) just crossed under the 200-DMA, forming a death-cross usually viewed as a bearish signal. 

If EUR/JPY sellers want to accelerate the downtrend, they will need to break below the October 6 low at 128.33. A breach of the latter would expose key support levels, like 128.00, followed by the February 4 low at 126.10.

On the flip side, if EUR buyers would like to reclaim control, they would need a daily close above the 100-DMA at 130.19. In that outcome, the following supply zone would be the convergence of the 50 and the 200-DMA around the 130.50-60 area.

EUR/JPY TECHNICAL SUPPORT/RESISTANCE LEVELS

Overview
Today last price129.21
Today Daily Change-0.69
Today Daily Change %-0.53
Today daily open129.9
 
Trends
Daily SMA20131.57
Daily SMA50130.58
Daily SMA100130.24
Daily SMA200130.52
 
Levels
Previous Daily High130.12
Previous Daily Low129.47
Previous Weekly High131.43
Previous Weekly Low130.23
Previous Monthly High133.48
Previous Monthly Low128.34
Daily Fibonacci 38.2%129.87
Daily Fibonacci 61.8%129.72
Daily Pivot Point S1129.54
Daily Pivot Point S2129.18
Daily Pivot Point S3128.89
Daily Pivot Point R1130.19
Daily Pivot Point R2130.48
Daily Pivot Point R3130.84

Author

Christian Borjon Valencia

Markets analyst, news editor, and trading instructor with over 14 years of experience across FX, commodities, US equity indices, and global macro markets.

More from Christian Borjon Valencia
Share:

Editor's Picks

EUR/USD drops below 1.1600 on broad USD strength

EUR/USD stays under bearish pressure and trades at a fresh six-week low below 1.1600 on Tuesday. Despite stronger-than-forecast inflation data from the Eurozone, the pair struggles to stage a rebound as the US Dollar continues to attract safe haven flows amid escalating geopolitical tensions in the Middle East. 

GBP/USD attacks 1.3300, refreshing three-month lows

GBP/USD is deep in the red near 1.3300, accelerating its downside to renew three-month lows in European trading on Tuesday. The ongoing escalation in the Iran war, combined with rising Oil prices, weighs negatively on the higher-yielding Pound Sterling as the US Dollar capitalizes on increased haven demand.

Gold drops below $5,200 on stronger USD, rallying US yields

Gold attracts some intraday selling and falls below $5,200 on Tuesday. The US Dollar climbs to a fresh high since January 20 and turns out to be a key factor exerting downward pressure on the commodity. Meanwhile, the benchmark 10-year US Treasury bond yield rises nearly 2% on the day, putting additional weight on XAU/USD's shoulders.

Crypto Today: Bitcoin, Ethereum, XRP pull back as sentiment remains in extreme market fear

The cryptocurrency market is broadly in the red on Tuesday as the Middle East grapples with an escalating war. Bitcoin (BTC) is in a pullback, trading below $67,000 at the time of writing, and most altcoins follow suit.

Middle East conflict ramps up a gear as energy price spike rips through markets

It’s another risk off day as geopolitical headwinds continue to batter financial markets. Although markets calmed during the US session and US stocks managed to post gains on Monday, this has not fed through to the European session, and stocks and bonds are sharply lower for a second day.

Hyperliquid Price Forecast: HYPE rises on commodities demand amid US-Iran war

Hyperliquid (HYPE) steadies above $33 at press time on Tuesday, marking its fourth consecutive day of recovery in a broadly volatile market due to the ongoing US-Israel strikes on Iran.