|

EUR/JPY Price Analysis: Hits two-day high around the Kumo but remains bearish

  • EUR/JPY hovers at around 157.30s, after rallying close to 1%, stalls at confluence of resistance levels.
  • Failure to break above 157.70 would pave the way to re-test 154.00.

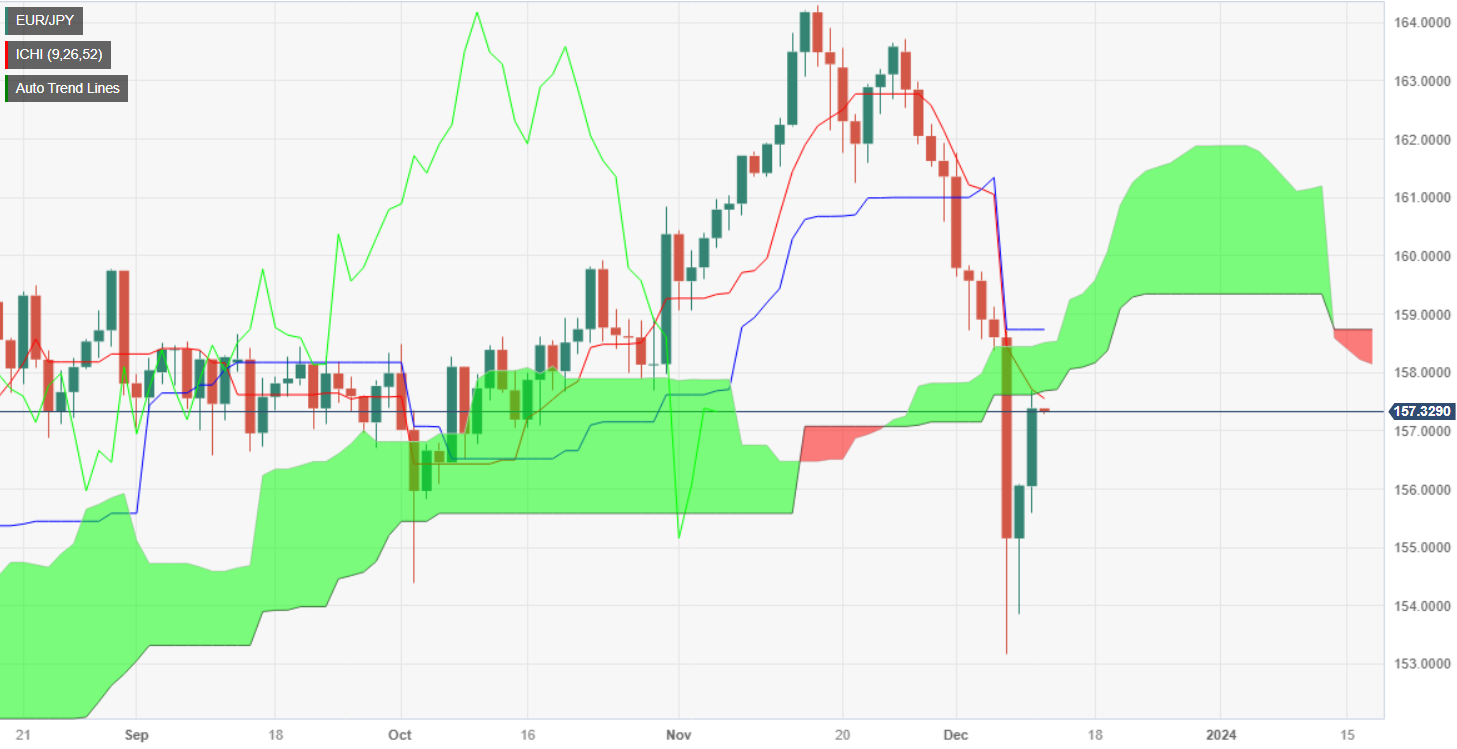
The EUR/JPY climbs close to 0.90% at the beginning of the week and tests a previous support trendline turned resistance at around the 157.20/30 area. Even though the pair is posting solid gains, it remains downward biased, as price action is below the Ichimoku Cloud (Kumo). That along the Chikou Span crossing below price action and the Tenkan-Sen crossing below the Kijun-Sen cements the bearish bias.

That said, EUR/JPY buyers need to reclaim the confluence of the Tenkan-Sen and the bottom of the Kumo at 157.60, followed by the Senkou Span A at 158.19. Further upside is seen above those two levels, at around the 159.00 figure.

For a bearish resumption, sellers must keep prices from breaching the Kumo. In that outcome, the first support would be the 157.00 mark, followed by the December 11 low of 155.86, followed by the December 8 swing low of 153.86.

EUR/JPY Price Analysis – Daily Chart

EUR/JPY Technical Levels

EUR/JPY

Overview
Today last price157.34
Today Daily Change1.28
Today Daily Change %0.82
Today daily open156.06
 
Trends
Daily SMA20161.33
Daily SMA50159.78
Daily SMA100158.71
Daily SMA200154.01
 
Levels
Previous Daily High156.09
Previous Daily Low153.86
Previous Weekly High159.84
Previous Weekly Low153.17
Previous Monthly High164.31
Previous Monthly Low159.07
Daily Fibonacci 38.2%155.24
Daily Fibonacci 61.8%154.72
Daily Pivot Point S1154.59
Daily Pivot Point S2153.11
Daily Pivot Point S3152.36
Daily Pivot Point R1156.82
Daily Pivot Point R2157.57
Daily Pivot Point R3159.05

Author

Christian Borjon Valencia

Markets analyst, news editor, and trading instructor with over 14 years of experience across FX, commodities, US equity indices, and global macro markets.

More from Christian Borjon Valencia
Share:

Editor's Picks

EUR/USD keeps the offered stance just above 1.1700

EUR/USD is coming under heavy selling pressure in what has been a rather grim start to the new trading week, with the pair now trading close to the 1.1700 support area as the US Dollar stages a solid rebound. The prevailing flight to safety mood continues to favour the Greenback, as investors react to the escalating conflict in the Middle East and trim risk exposure across the board.

GBP/USD hits new yearly lows near 1.3300

GBP/USD adds to the recent bearish tone, approaching to the key 1.3300 support to reach fresh YTD troughs against the backdrop of the robust performance of the US Dollar. Indeed, Cable’s decline comes amid the firm demand for the safe-haven space in the wake of the US and Israel attacks to Iran.

Gold trims losses, back below $5,400

Gold now surrenders part of the earlier advance past the $5,400 mark per troy ounce at the beginning of the week. Indeed, the precious metal’s strong uptick remains fuelled by increasing geopolitical tensions in the Middle East amid the intense demand for safer assets.

Bitcoin on brink of breakdown amid US-Iran war

Bitcoin (BTC) remains under pressure near the key support level of $65,700. Trading at $66,400 at the time of writing on Monday, a breakdown below this critical level would suggest a deeper correction ahead.

The Fed is finally talking about AI – Here's why it matters for the US Dollar

AI is moving from earnings calls into the heart of monetary policy discussions, forcing Federal Reserve officials to confront a new question: How to act if AI reshapes inflation, employment and interest rates at the same time?

Grass 20% bullish breakout defies broader market weakness

Grass (GRASS) is edging up above $0.30 at the time of writing on Monday. The token’s notable 20% intraday surge stands out amid heightened volatility in the broader crypto market.