|

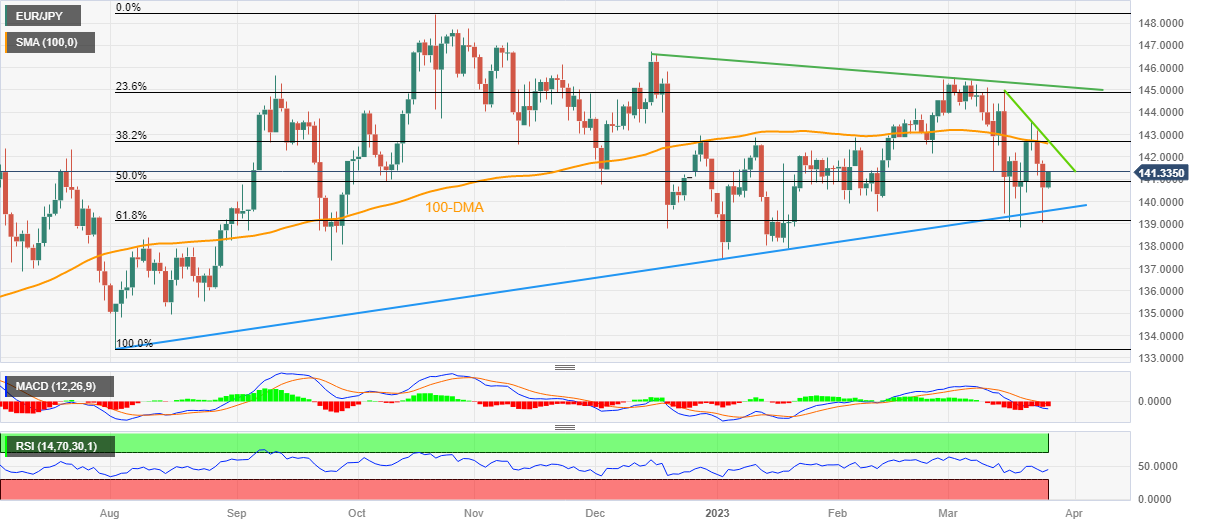
EUR/JPY Price Analysis: Extends bounce off golden Fibonacci ratio towards 141.50

  • EUR/JPY grinds higher around intraday top during the first positive day in three.
  • Successful rebound from 61.8% Fibonacci retracement, ascending trend line from August 2022 lures buyers.
  • Oscillators appear less lucrative as 100-DMA, short-term resistance line challenge immediate upside.
  • Limited upside expected; bulls may remain cautious below 145.20.

EUR/JPY snaps two-day losing streak as it grinds higher past 141.00 during early Monday morning in Europe. In doing so, the cross-currency pair bounces off the 61.8% Fibonacci retracement of its August-October 2022 upside, also known as the golden Fibonacci retracement, as well as extending the rebound from nearly eight-month-old ascending support line.

The recovery moves, however, remain elusive unless crossing the 142.60-75 resistance confluence zone comprising the 100-DMA, descending trend line from March 15 and 38.2% Fibonacci retracement. It’s worth noting that the bearish MACD signals and downbeat RSI also keep sellers hopeful.

Even if the EUR/JPY price rises beyond 142.75, a downward-sloping resistance line from mid-December 2022, close to 145.25, could challenge the bulls.

Following that, the late 2022 peak surrounding 146.75 and the previous yearly peak of 148.40 will be in focus.

On the flip side, the multi-month-old ascending trend line, near 139.65 at the latest, restricts the short-term downside of the EUR/JPY pair before the 61.8% Fibonacci retracement level of 139.15.

It should be observed that the 140.00 round figure acts as an adjacent support while a downside break of 139.15 won’t hesitate to challenge the yearly low marked in January around 137.40

EUR/JPY: Daily chart

Trend: Limited recovery expected

Additional important levels

Overview
Today last price141.14
Today Daily Change0.50
Today Daily Change %0.36%
Today daily open140.64
 
Trends
Daily SMA20143.22
Daily SMA50142.24
Daily SMA100142.66
Daily SMA200141.84
 
Levels
Previous Daily High141.85
Previous Daily Low139.07
Previous Weekly High143.63
Previous Weekly Low138.83
Previous Monthly High145.47
Previous Monthly Low139.55
Daily Fibonacci 38.2%140.13
Daily Fibonacci 61.8%140.79
Daily Pivot Point S1139.19
Daily Pivot Point S2137.74
Daily Pivot Point S3136.41
Daily Pivot Point R1141.97
Daily Pivot Point R2143.3
Daily Pivot Point R3144.74

Author

Anil Panchal

Anil Panchal

FXStreet

Anil Panchal has nearly 15 years of experience in tracking financial markets. With a keen interest in macroeconomics, Anil aptly tracks global news/updates and stays well-informed about the global financial moves and their implications.

More from Anil Panchal
Share:

Editor's Picks

EUR/USD eyes nine-day EMA barrier after rebounding from 1.1600

EUR/USD gains ground after registering modest losses in the previous session, trading around 1.1620 during the Asian hours on Friday. The technical analysis of the daily chart suggests an ongoing bearish bias as the pair remains within the descending channel pattern.

GBP/USD: Pound Sterling ticks up against US Dollar in countdown to US NFP

The Pound Sterling trades marginally higher to near 1.3365 against the US Dollar during the Asian trading session on Friday. The GBP/USD pair edges up as the US Dollar ticks down ahead of the United States Nonfarm Payrolls data for February, which will be published at 13:30 GMT.

Gold awaits US Nonfarm Payrolls for a clear directional impetus

Gold rebounds above $5,100 early Friday after testing the $5,050 level amid global sell-off. The US Dollar pulls back as profit-taking creeps in ahead of US labor data. For February. 21-day SMA holds amid bullish RSI; a daily closing above 61.8% Fibo is critical for Gold buyers.

Top Crypto Gainers: Lombard, Humanity Protocol, OKB rally on US Fed’s tokenized securities clarity, NYSE investment

Lombard, Humanity Protocol, and OKB rally over the last 24 hours, securing the top-gainer spots in the early Asian session. The US Federal Reserve issued clarity on tokenized securities, which expands its utility and reduces regulatory friction with US banks, driving the Real-World Assets tokenization crypto projects. 

The market compass is pointing at a barrel of Oil

The Asian open is arriving with equities leaning the wrong way, and the reason is not complicated. The market’s compass needle has snapped firmly toward crude. In this tape, oil is not just another input price; it is the gravitational center around which every asset class is orbiting.

Ripple tests recovery strength amid steady ETF inflows, growing retail interest

Ripple (XRP) continues to demonstrate notable resilience as the cryptocurrency market navigates the persistent war in the Middle East after the United States (US) and Israel attacked Iran on Saturday.