|

EUR/JPY Price Analysis: Establishes above 20-EMA, 137.00 a key hurdle

  • EUR/JPY is oscillating between 20- and 50-EMAs, which indicates a volatility contraction.
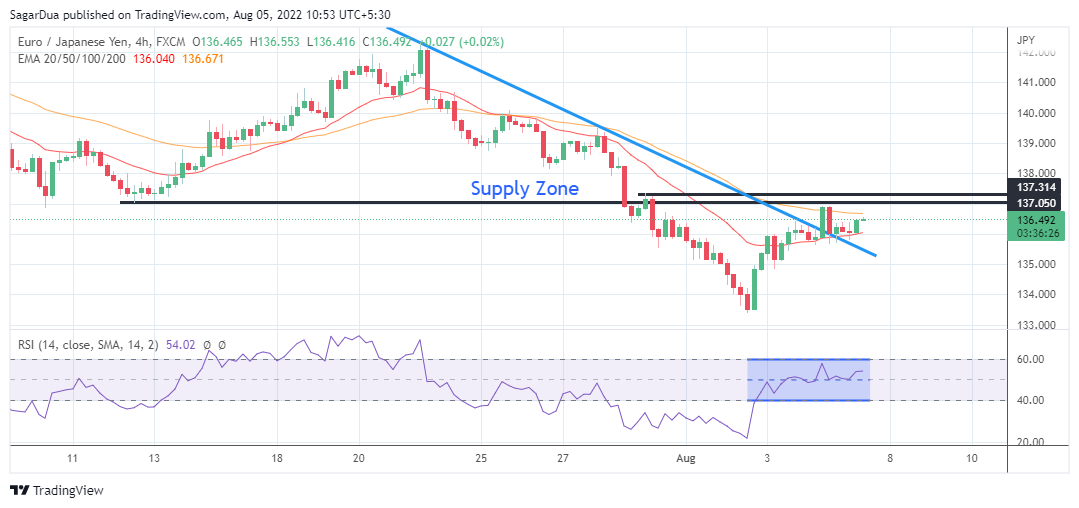
  • An establishment above the downwards-sloping trendline has strengthened the eurozone bulls.
  • For further upside, the asset needs to violate the 137.05-137.31 supply area.

The EUR/JPY pair is aiming gradually higher after a bullish open test-drive move in the Asian session. The cross is continuously facing barricades around the critical resistance of 136.50. On a broader note, the asset is scaling higher after printing a low of 133.39 on Tuesday, has added 2.60% and bulls are still gearing for a fresh rally.

Confident stability above the downward sloping trendline, on a four-hour scale, plotted from July 21 high at 142.33 has strengthened the shared currency bulls. However, the supply zone placed in a 137.05-137.31 range will act as a major resistance ahead.

The 50-period Exponential Moving Average (EMA) at 136.65 is restricting the eurozone bulls from scaling higher while the 20-MA at 136.00 is providing a cushion to the asset. An oscillation of an asset in a mid of 20 and 50-EMAs signals a volatility contraction.

Also, the Relative Strength Index (RSI) (14) has shifted into the 40.00-60.00 range, which indicates that the asset is awaiting a potential trigger for a meaningful move.

Should the asset violates the above-mentioned supply zone firmly, the eurozone bulls will drive the asset towards July 26 low at 138.13, followed by July 27 high at 139.51.

On the contrary, the yen bulls could regain strength if the asset drops below Thursday’s low at 135.66. An occurrence of the same will drag the asset towards Wednesday’s low and Tuesday’s low at 134.83 and 133.39 respectively.

EUR/JPY four-hour chart

EUR/JPY

Overview
Today last price136.26
Today Daily Change0.10
Today Daily Change %0.07
Today daily open136.16
 
Trends
Daily SMA20138.28
Daily SMA50139.87
Daily SMA100137.87
Daily SMA200133.77
 
Levels
Previous Daily High136.92
Previous Daily Low135.64
Previous Weekly High140.08
Previous Weekly Low135.55
Previous Monthly High142.43
Previous Monthly Low135.55
Daily Fibonacci 38.2%136.43
Daily Fibonacci 61.8%136.13
Daily Pivot Point S1135.56
Daily Pivot Point S2134.96
Daily Pivot Point S3134.28
Daily Pivot Point R1136.84
Daily Pivot Point R2137.52
Daily Pivot Point R3138.12

Author

Sagar Dua

Sagar Dua

FXStreet

Sagar Dua is associated with the financial markets from his college days. Along with pursuing post-graduation in Commerce in 2014, he started his markets training with chart analysis.

More from Sagar Dua
Share:

Markets move fast. We move first.

Orange Juice Newsletter brings you expert driven insights - not headlines. Every day on your inbox.

By subscribing you agree to our Terms and conditions.

Editor's Picks

EUR/USD flatlines below 1.1800 ahead of Fed Minutes

EUR/USD struggles to find direction and continues to move sideways below 1.1800 for the second consecutive day on Tuesday as markets remain in holiday mood. Later in the American session, the Federal Reserve will publish the minutes of the December policy meeting.

GBP/USD retreats to 1.3500 area following earlier climb

GBP/USD loses its traction and trades flat on the day near 1.3500 after rising to the 1.3530 area early Tuesday. Trading conditions remain thin ahead of the New Year holiday, limiting the pair's volatility. The Fed will publish December meeting minutes in the late American session.

Gold aims to regain the ground lost

Gold gathers recovery momentum and advances toward $4,400 on Tuesday after losing more than 4% on Monday. Increased margin requirements on gold and silver futures by the Chicago Mercantile Exchange Group, one of the world’s largest trading floors for commodities, prompted widespread profit-taking and portfolio rebalancing.

Tron steadies as Justin Sun invests $18 million in Tron Inc.

Tron (TRX) trades above $0.2800 at press time on Monday, hovering below the 50-day Exponential Moving Average (EMA) at $0.2859.

Economic outlook 2026-2027 in advanced countries: Solidity test

After a year marked by global economic resilience and ending on a note of optimism, 2026 looks promising and could be a year of solid economic performance. In our baseline scenario, we expect most of the supportive factors at work in 2025 to continue to play a role in 2026.

Crypto market outlook for 2026

Year 2025 was volatile, as crypto often is.  Among positive catalysts were favourable regulatory changes in the U.S., rise of Digital Asset Treasuries (DAT), adoption of AI and tokenization of Real-World-Assets (RWA).