|

EUR/JPY Price Analysis: Eight-year high above 147.00 kept bulls from testing 149.00

  • EUR/JPY retraces from weekly highs around 147.30s, on risk-aversion, due to BoJ’s intervention woes.
  • Near-term, the EUR/JPY is neutral biased, though a break above 147.30 will expose 148.00 and beyond; otherwise, a fall under 146.00 is on the cards.

The EUR/JPY consolidates nearby weekly highs, around the 146.80 mark, retracing from YTD highs at 147.29, due to risk-aversion and high US Treasury yields advancing sharply, while Fed hawkish commentary on Thursday, spooked investors as the Federal Reserve gets ready to lift rates to 4%. Therefore, the EUR/JPY is trading at 146.87, below its opening price by a minuscule 0.03%.

EUR/JPY Price Forecast

The EUR/JPY daily chart portrays the pair as upward biased. Worth noting, the cross-currency pair, is reange-bound, trading in the upper 146.00-14730 area, unable to test the 148.00 mark. Of note, EUR buyers were unable to rally to 148.00, probably on fears that the Bank of Japan (BoJ) could intervene in the market, as speculations mounted that on Thursday, they did it. Nevertheless, if those rumors fade, a test to 148.00 is likely, as EUR/JPY buyer eye 150.00.

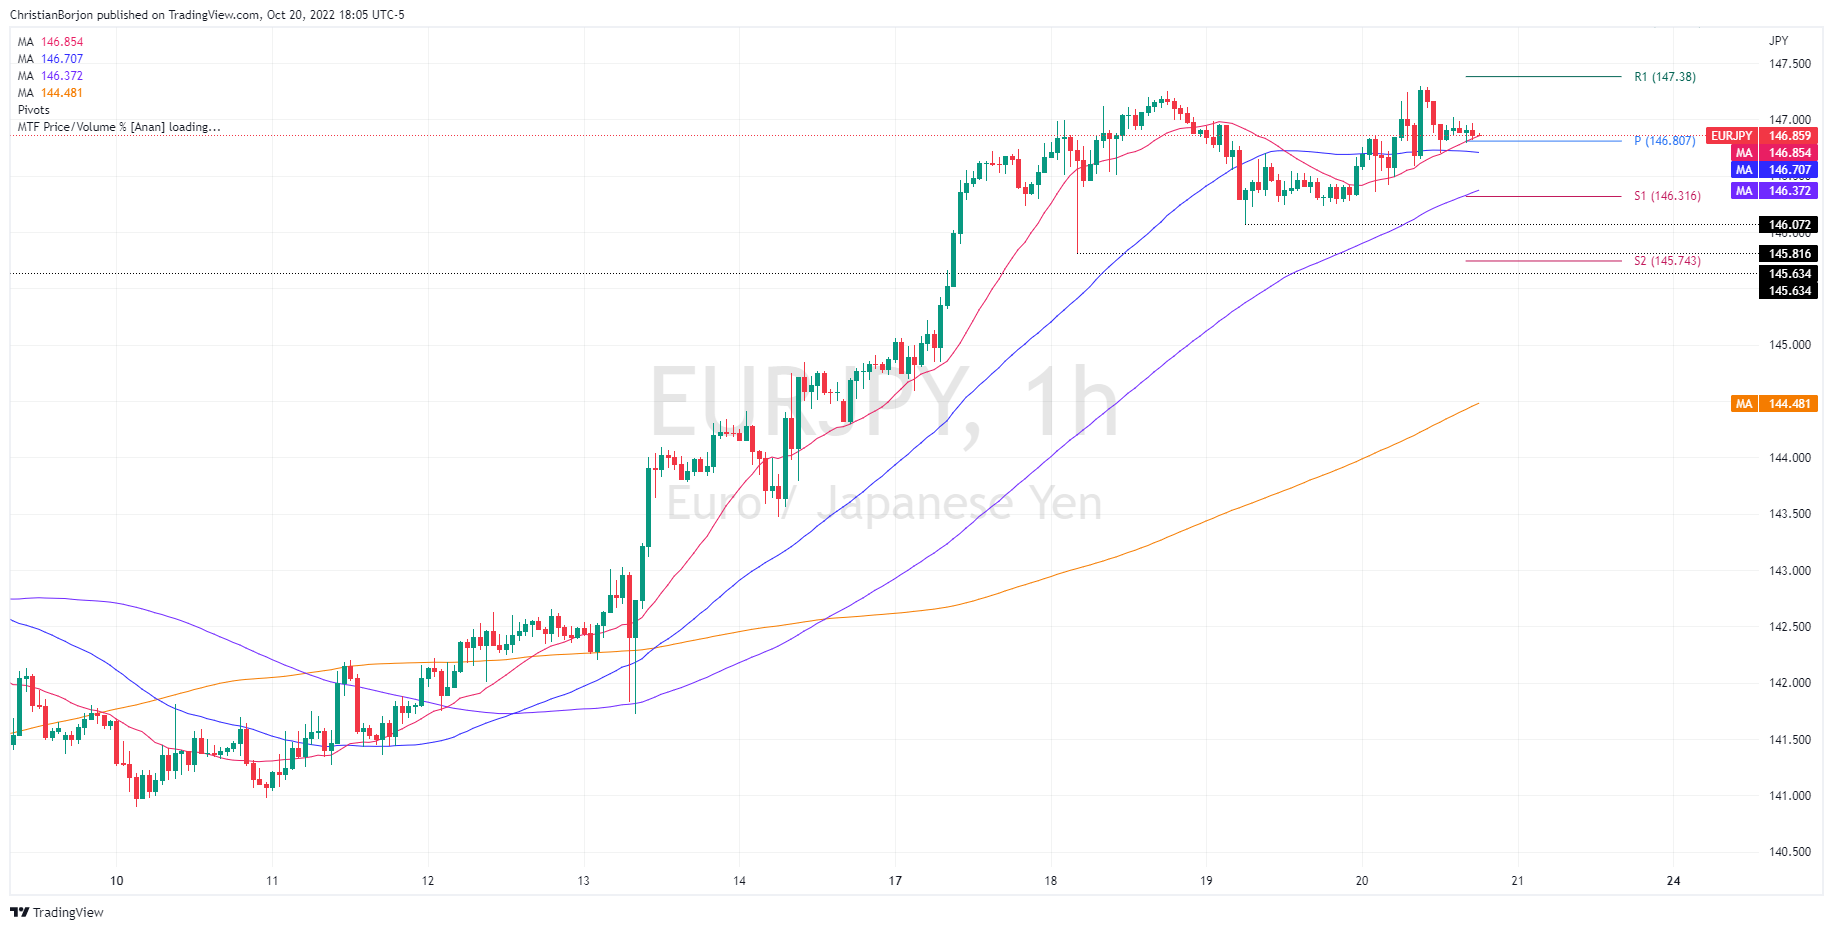
Short term, the EUR/JPY one-hour chart suggests the pair as range-bound, supported by the confluence of the daily pivot point and the 20-Exponential Moving Average (EMA) at 146.84. Underneath the latter, the 50-EMA flat-slope suggests the pair will remain volatile around the 146.80-147.30 area, but the Relative Strength Index (RSI) aiming lower, about to enter the bearish territory, could open the door for a retest of October 19 lows at 146.07, followed by the October 18, weekly low of 145.81.

On the other hand, if the cross clears the YTDhigh at 147.30, the next resistance is 147.39. Once broken, the following supply areas would be the S2 pivot level at 147.87, followed by the S3 pivot point at 148.44.

EUR/JPY Key Technical Levels

EUR/JPY

Overview
Today last price146.87
Today Daily Change0.31
Today Daily Change %0.21
Today daily open146.56
 
Trends
Daily SMA20142.41
Daily SMA50140.9
Daily SMA100140.38
Daily SMA200136.72
 
Levels
Previous Daily High147.26
Previous Daily Low146.08
Previous Weekly High144.85
Previous Weekly Low140.9
Previous Monthly High145.64
Previous Monthly Low137.38
Daily Fibonacci 38.2%146.53
Daily Fibonacci 61.8%146.81
Daily Pivot Point S1146
Daily Pivot Point S2145.45
Daily Pivot Point S3144.82
Daily Pivot Point R1147.18
Daily Pivot Point R2147.81
Daily Pivot Point R3148.36

Author

Christian Borjon Valencia

Markets analyst, news editor, and trading instructor with over 14 years of experience across FX, commodities, US equity indices, and global macro markets.

More from Christian Borjon Valencia
Share:

Editor's Picks

EUR/USD faces some resistance near 100-SMA on H4, around 1.1830 zone

The EUR/USD pair gains some follow-through positive traction for the second consecutive day and climbs to the 1.1830 region during the Asian session on Thursday. The US Dollar remains on the back foot amid concerns about the economic fallout from US President Donald Trump's erratic trade policies and acts as a tailwind for spot prices.

GBP/USD extends recovery to near 20-day EMA as US Dollar weakens

The Pound Sterling holds onto weekly gains around 1.3565 against the US Dollar during the Asian trading session on Thursday. The GBP/USD pair trades firmly as the US Dollar remains under pressure due to uncertainty surrounding the United States trade policy outlook.

Gold struggle with $5,200 extends ahead of more US-Iran talks

Gold is replicating the recovery moves seen in Wednesday’s Asian trading early Thursday, as buyers continue to flirt with the $5,200 level. Sustained US Dollar weakness and looming US-Iran talks aid the bright metal’s rebound.  

Stellar: Relief bounce fades as bearish undertone persists

Stellar is trading around $0.16 at the time of writing on Thursday after rebounding more than 8% in the previous day. Derivatives data paints a negative picture as XLM’s short bets hit a monthly high while Open Interest continues to decline.

Nvidia delivers another monster earnings report, and forecasts big things to come

It was another monster earnings report from Nvidia for fiscal Q4. Revenues were $68.1bn, smashing estimates of $65bn. Gross profit margin was a healthy 75%, up from 73.5% in the prior quarter, and the outlook for this quarter was monstrous.

Solana Price Forecast: SOL strikes key resistance with double-digit gains

Solana trades at $88 at press time on Thursday, after an 11% upswing the previous day within a broader consolidation range of roughly three weeks. Institutional demand for Solana heightens as US spot SOL Exchange Traded Funds record $30 million of inflow on Wednesday.