|

EUR/JPY Price Analysis: Climbs towards 138.00 despite a risk-off impulse

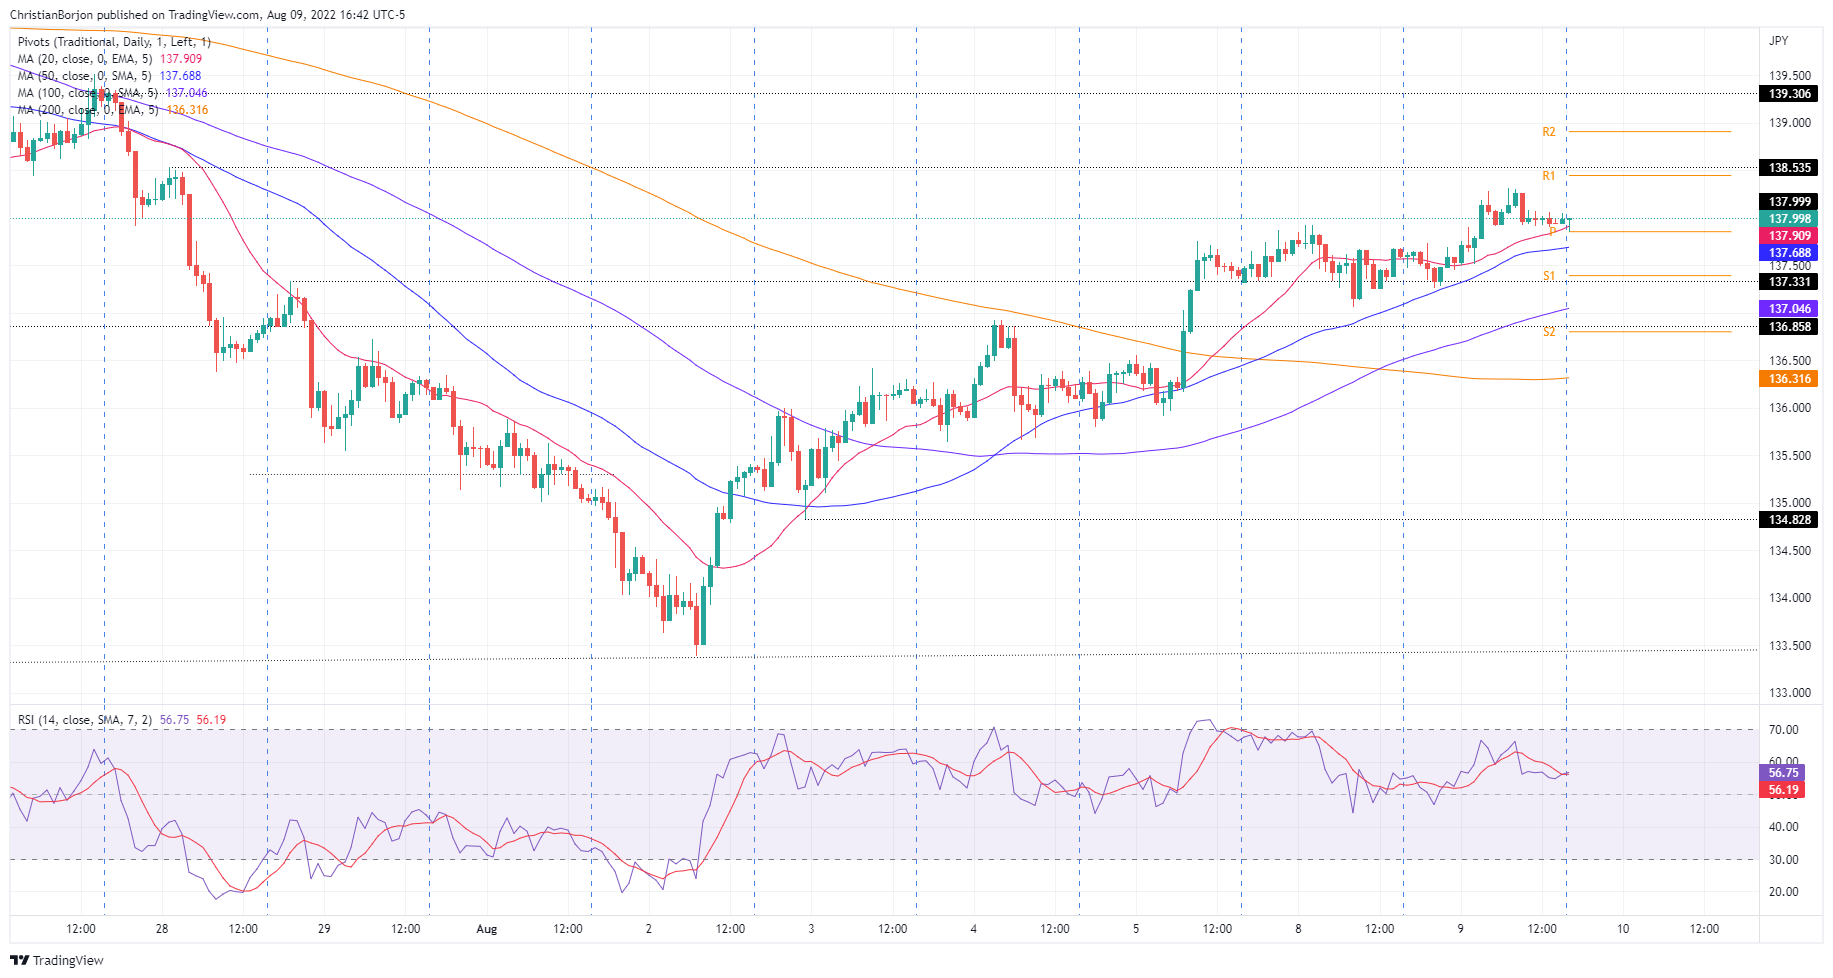
  • The EUR/JPY daily chart illustrates the pair as neutral-to-downwards biased.
  • In the short term, the EUR/JPY might test the 20-day EMA at 138.20 before tumbling to 137.00.

On Tuesday, the EUR/JPY finished the session with minimal gains of 0.28%. However, as the Wednesday Asian session begins, the JPY appreciates while Asian stocks are set for a lower open. At the time of writing, the EUR/JPY is trading at 137.96.

The financial markets narrative remains the same. A US company reported that its economic outlook looks worse than estimated, adding to recession fears. The US bond market shows signs of an impending recession, with the yield curve inversion between the 2s-10s year bond yields further deepening. Despite the previously mentioned factors, the euro stood tall and edged higher vs. the yen.

EUR/JPY Price Analysis: Technical outlook

From a daily chart perspective, the cross-currency is neutral-to-downward biased. A series of successively lower highs/lows confirms the latter. Meanwhile, the 20, 50, and 100-day EMAs above the exchange rate further cement the bias. Therefore, EUR/JPY traders should be aware that unless buyers reclaim the 100-day EMA at 139.84, further selling pressure is on the cards.

The 1-hour EUR/JPY chart portrays the pair advancing steadily, with the hourly Mas below the spot price, while the RSI, albeit below its 7-RSI SMA, signals that buyers are in control. Therefore, don’t discount a leg-up before the one-hour chart aligns with the daily chart’s overall bias.

Therefore, the EUR/JPY first resistance would be the 138.00 figure. A breach of the latter will send the EUR/JPY towards the August 9 high at 138.31, followed by the R2 daily pivot point at 138.92.

EUR/JPY Hourly chart

EUR/JPY Key Technical Levels

EUR/JPY

Overview
Today last price137.99
Today Daily Change0.59
Today Daily Change %0.43
Today daily open137.42
 
Trends
Daily SMA20138.2
Daily SMA50139.89
Daily SMA100137.99
Daily SMA200133.82
 
Levels
Previous Daily High137.93
Previous Daily Low137.07
Previous Weekly High137.76
Previous Weekly Low133.4
Previous Monthly High142.43
Previous Monthly Low135.55
Daily Fibonacci 38.2%137.4
Daily Fibonacci 61.8%137.6
Daily Pivot Point S1137.01
Daily Pivot Point S2136.61
Daily Pivot Point S3136.16
Daily Pivot Point R1137.87
Daily Pivot Point R2138.33
Daily Pivot Point R3138.73

Author

Christian Borjon Valencia

Markets analyst, news editor, and trading instructor with over 14 years of experience across FX, commodities, US equity indices, and global macro markets.

More from Christian Borjon Valencia
Share:

Editor's Picks

EUR/USD stays weak near 1.1850 after dismal German ZEW data

EUR/USD remains in the red near 1.1850 in the European session on Tuesday. A broad US Dollar bullish consolidation combined with a softer risk tone keep the pair undermined alongside downbeat German ZEW sentiment readings for February. 

GBP/USD holds losees near 1.3600 after weak UK jobs report

GBP/USD is holding moderate losses near the 1.3600 level in Tuesday's European trading. The United Kingdom employment data suggested worsening labor market conditions, bolstering bets for a BoE interest rate cut next month. This narrative keeps the Pound Sterling under bearish pressure. 

Gold pares intraday losses; keeps the red above $4,900 amid receding safe-haven demand

Gold (XAU/USD) attracts some follow-through selling for the second straight day and dives to over a one-week low, around the $4,858 area, heading into the European session on Tuesday. 

Canada CPI expected to show sticky inflation in January, still above BoC’s target

Economists see the headline CPI rising by 2.4% in a year to January, still above the BoC’s target and matching December’s increase. On a monthly basis, prices are expected to rise by 0.1%.

UK jobs market weakens, bolstering rate cut hopes

In the UK, the latest jobs report made for difficult reading. Nonetheless, this represents yet another reminder for the Bank of England that they need to act swiftly given the collapse in inflation expected over the coming months. 

Stellar mixed sentiment caps recovery

Stellar price remains under pressure, trading at $0.170 on Tuesday after failing to close above the key resistance on Sunday. The derivatives metric supports the bearish sentiment, with XLM’s short bets rising among traders and funding rates turning negative.