- EUR/JPY could meet the psychological resistance at the 163.00 level following February’s high at 163.72.
- EUR/JPY cross could find immediate support at the major level of 162.50.
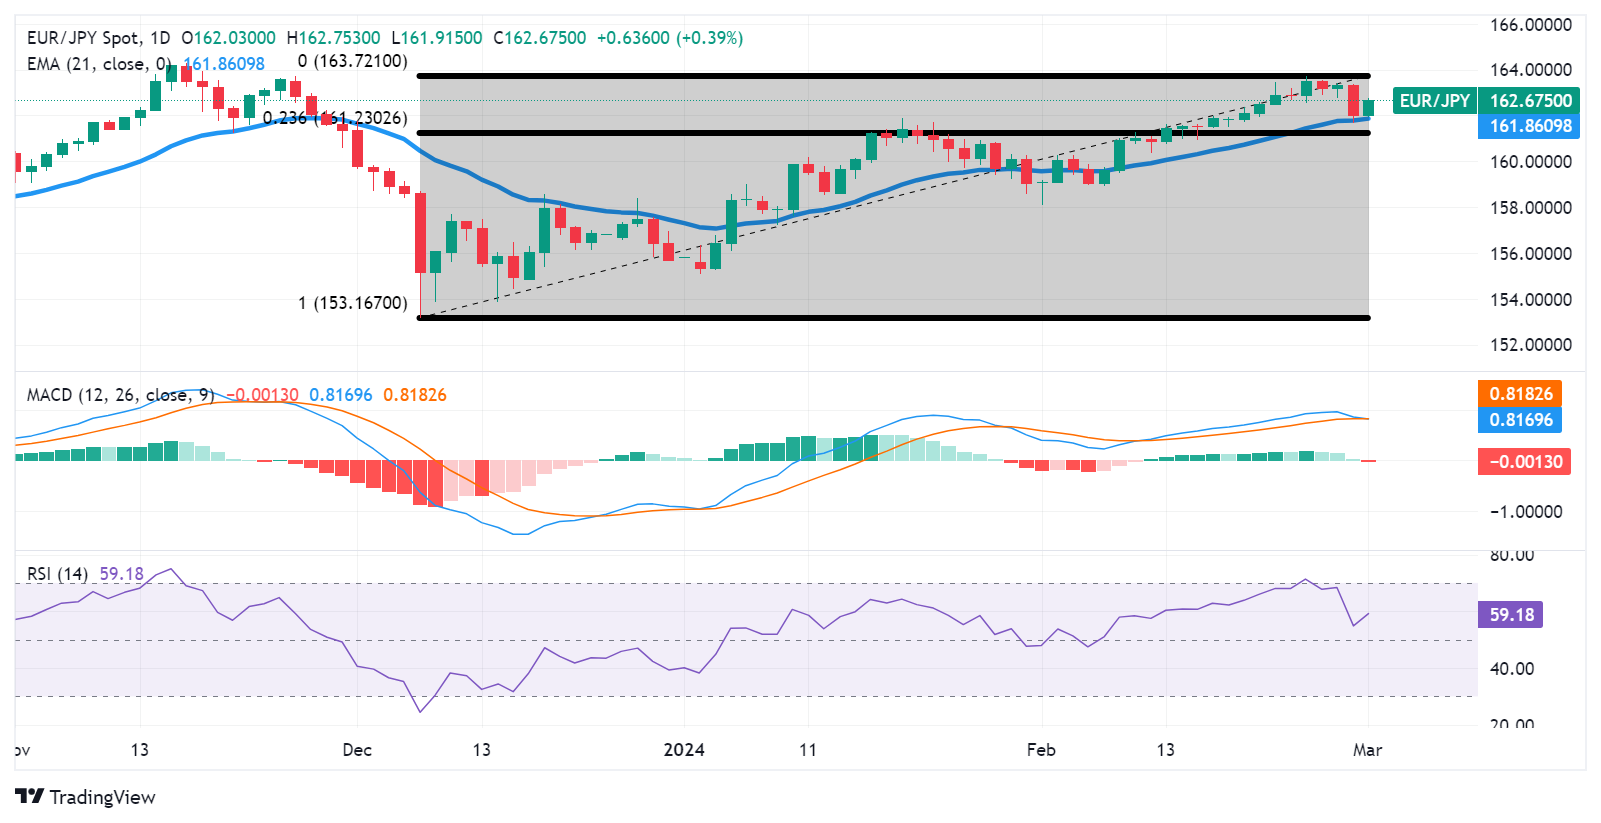
- 14-day RSI indicates a bullish sentiment for the cross.
EUR/JPY retraces its recent losses, trading higher around 162.70 during the Asian session on Friday, following the psychological barrier of 163.00 level. A breakthrough above this barrier could lead the cross to explore the further resistance zone around the major level of 163.50 followed by February’s high at 163.72.
Technical analysis indicates a bullish sentiment for the EUR/JPY cross. The 14-day Relative Strength Index (RSI) is positioned above the 50 mark, signaling strength in the upward momentum.
However, the Moving Average Convergence Divergence (MACD) line is aligned with the signal line, indicating a convergence, while remaining above the centerline. Although the MACD is a lagging indicator, this configuration suggests a subdued momentum for the EUR/JPY cross at the moment.
On the downside, the EUR/JPY cross may encounter immediate support at the major level of 162.50, followed by the psychological level of 162.00. A breach below this support level could exert downward pressure on the pair, potentially testing the 21-day Exponential Moving Average (EMA) at 161.86.
Additionally, a further support zone for the EUR/JPY cross is anticipated around the major level of 161.50, with another significant support level near the 23.6% Fibonacci retracement level at 161.23.
EUR/JPY: Daily Chart
Information on these pages contains forward-looking statements that involve risks and uncertainties. Markets and instruments profiled on this page are for informational purposes only and should not in any way come across as a recommendation to buy or sell in these assets. You should do your own thorough research before making any investment decisions. FXStreet does not in any way guarantee that this information is free from mistakes, errors, or material misstatements. It also does not guarantee that this information is of a timely nature. Investing in Open Markets involves a great deal of risk, including the loss of all or a portion of your investment, as well as emotional distress. All risks, losses and costs associated with investing, including total loss of principal, are your responsibility. The views and opinions expressed in this article are those of the authors and do not necessarily reflect the official policy or position of FXStreet nor its advertisers. The author will not be held responsible for information that is found at the end of links posted on this page.
If not otherwise explicitly mentioned in the body of the article, at the time of writing, the author has no position in any stock mentioned in this article and no business relationship with any company mentioned. The author has not received compensation for writing this article, other than from FXStreet.
FXStreet and the author do not provide personalized recommendations. The author makes no representations as to the accuracy, completeness, or suitability of this information. FXStreet and the author will not be liable for any errors, omissions or any losses, injuries or damages arising from this information and its display or use. Errors and omissions excepted.
The author and FXStreet are not registered investment advisors and nothing in this article is intended to be investment advice.
Recommended content
Editors’ Picks

AUD/USD looks solid and approaches 0.6300
The weekly recovery in AUD/USD remained unabated on Wednesday, with spot approaching the key resistance at 0.6300 the figure amid the continuation of the selling bias in the US Dollar.

EUR/USD keeps its recovery in place
Extra decline in the Greenback collaborated with further recovery in the risk complex and helped EUR/USD reclaim the 1.0400 barrier and beyond, adding to Tuesday’s advance and climbing to multi-day highs.

unstoppable record rally continues
Further gains propel the ounce troy of Gold to all-time highs near the $2,880 mark on the back of the weak US Dollar, declining US yields across the curve and safe haven demand propped up by tariffs concerns.

Will Dogecoin outshine XRP? Publicly traded Canadian firm buys 1 million DOGE
Dogecoin (DOGE) and XRPLedger’s native token XRP observe a correction on Wednesday, extending their losses from the past seven days. DOGE is down 2.43% and XRP lost nearly 5% of its value on the day.

Takeaways of Trump 2.0 two weeks in
In this report, we examine a few of the key takeaways from President Trump's first few weeks in office, including why the European Union could be Trump's next tariff target and why Trump has less leverage over China this time than during the first trade war.

The Best Brokers of the Year
SPONSORED Explore top-quality choices worldwide and locally. Compare key features like spreads, leverage, and platforms. Find the right broker for your needs, whether trading CFDs, Forex pairs like EUR/USD, or commodities like Gold.