|

EUR/JPY Price Analysis: Bulls times might be up as indicators approach overbought territory

  • The daily RSI and MACD remain in positive territory but suggest that consolidation may be incoming..
  • The same indicators on the hourly chart hint also signal a possible consolidation phase subsequent to recent gains.
  • The EUR/JPY's position above primary SMAs maintains long-term bullish sentiment.

In Monday's session, the EUR/JPY pair is trading mildly higher, showing continued dominance by the bulls. However, caution must be exercised due to signs of overbought conditions, which tend to be followed by downward movements

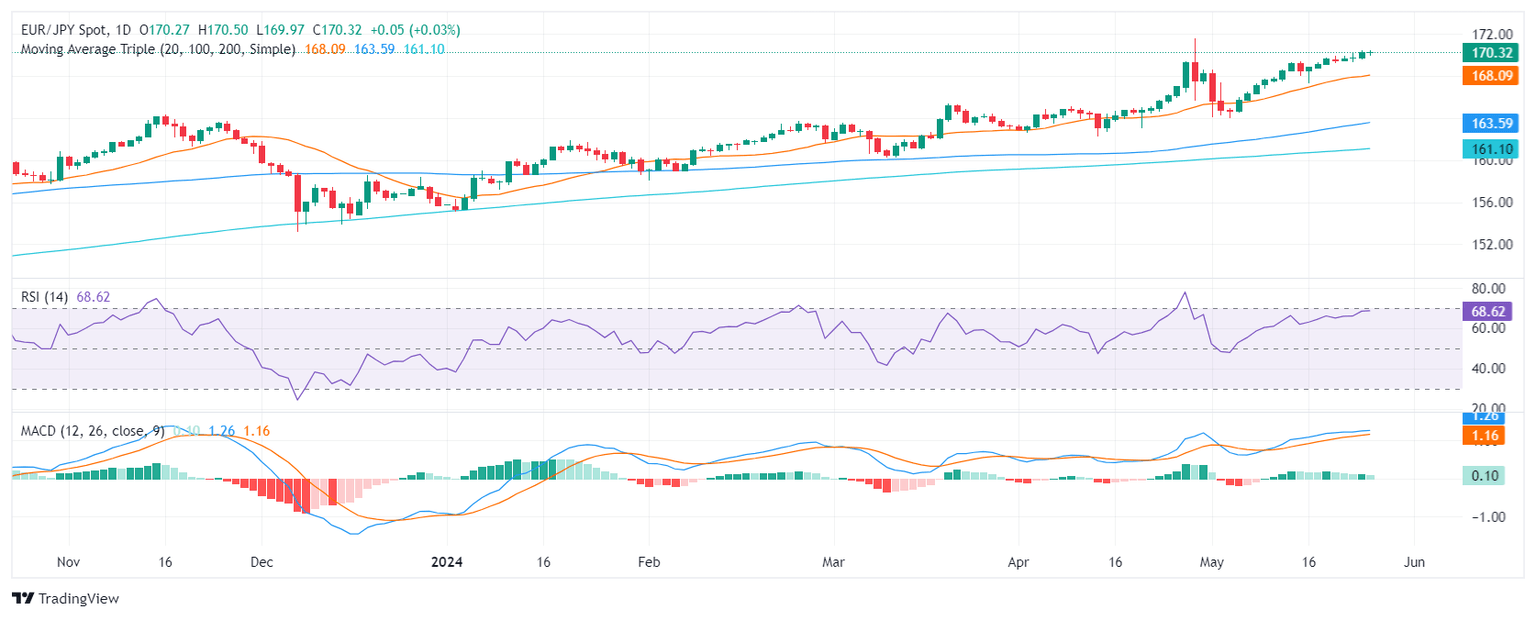
In the daily analysis, the Relative Strength Index (RSI) for the EUR/JPY pair has been observing a steady positive trend. It points out that buyers hold a strong position with the latest reading nearing overbought territory. Concurrently, the Moving Average Convergence Divergence (MACD) histogram fortifies this stance, demonstrating flat green bars symbolizing a steady but flattening positive momentum.

EUR/JPY daily chart

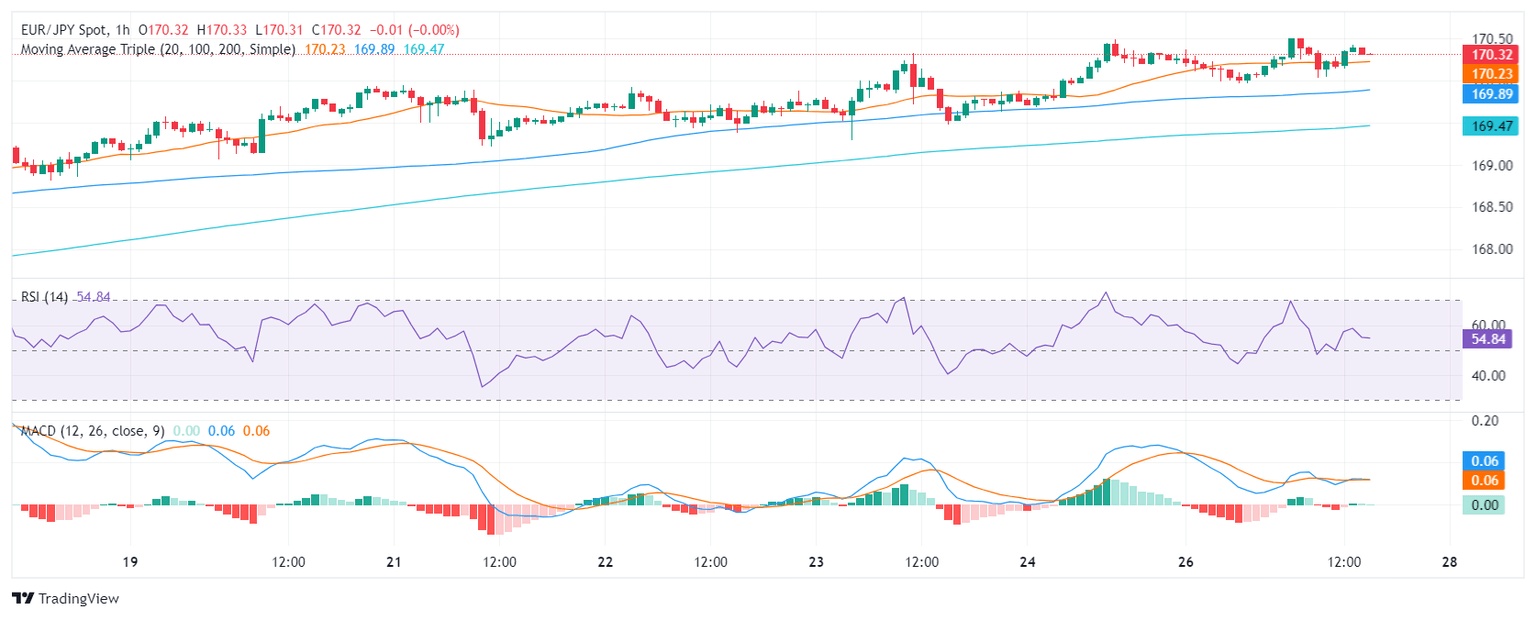
Transitioning to the hourly chart, the RSI has dipped from high-positive towards a negative slope, with the latest reading at 54, distancing itself from an earlier overbought condition. The MACD histogram also hints at a pace alteration, continuing to print flat green bars, implying a downturn in buying pressure.

EUR/JPY hourly chart

The EUR/JPY robust performance is highlighted by its position above the key Simple Moving Average (SMA) benchmarks at 20,100, and 200 days. However, a technical correction may be incoming but any movements which keep the pair above these levels could be considered as mere consolidation.

EUR/JPY

Overview
Today last price170.32
Today Daily Change0.05
Today Daily Change %0.03
Today daily open170.27
 
Trends
Daily SMA20167.96
Daily SMA50165.87
Daily SMA100163.46
Daily SMA200161.04
 
Levels
Previous Daily High170.5
Previous Daily Low169.63
Previous Weekly High170.5
Previous Weekly Low169.05
Previous Monthly High171.6
Previous Monthly Low162.28
Daily Fibonacci 38.2%170.17
Daily Fibonacci 61.8%169.96
Daily Pivot Point S1169.76
Daily Pivot Point S2169.26
Daily Pivot Point S3168.9
Daily Pivot Point R1170.63
Daily Pivot Point R2171
Daily Pivot Point R3171.5

Author

Patricio Martín

Patricio is an economist from Argentina passionate about global finance and understanding the daily movements of the markets.

More from Patricio Martín
Share:

Editor's Picks

EUR/USD sticks to positive bias above 1.1800 as trade jitters undermine USD

The EUR/USD pair builds on the previous day's modest gains and attracts some buyers for the second straight day on Thursday amid a softer US Dollar. Spot prices, however, lack bullish conviction and trade around the 1.1815-1.1820 area during the Asian session, up 0.10% for the day.

GBP/USD bounces as soft CPI boosts BoE cut bets

GBP/USD rose 0.42% on Wednesday, recovering toward 1.3600 in a session shaped by softer-than-expected UK inflation data and broad US Dollar weakness. The pair had been consolidating in a tight range between about 1.3450 and 1.3520 for the past few days following the sharp pullback from the late-January high near 1.3870, and Wednesday's move pushed price action back onto the high side of key moving averages.

Gold struggle with $5,200 extends ahead of more US-Iran talks

Gold is replicating the recovery moves seen in Wednesday’s Asian trading early Thursday, as buyers continue to flirt with the $5,200 level. Sustained US Dollar weakness and looming US-Iran talks aid the bright metal’s rebound.  

Michael Saylor unveils Bitcoin-backed "Digital Credit" vision at Strategy World

Strategy CEO Michael Saylor delivered a keynote titled "Digital Credit" on Tuesday at Strategy World, positioning Bitcoin as the foundation of a new financial system built on what he described as "digital capital."

Nvidia delivers another monster earnings report, and forecasts big things to come

It was another monster earnings report from Nvidia for fiscal Q4. Revenues were $68.1bn, smashing estimates of $65bn. Gross profit margin was a healthy 75%, up from 73.5% in the prior quarter, and the outlook for this quarter was monstrous.

Cosmos Hub Price Forecast: ATOM rebounds slightly, bearish outlook remains intact

Cosmos Hub (ATOM) price rebounds, trading above $2.05 at the time of writing on Wednesday, after undergoing a sharp correction since last week. Weakening on-chain and derivatives data support a bearish outlook, while technical analysis remains unfavorable.