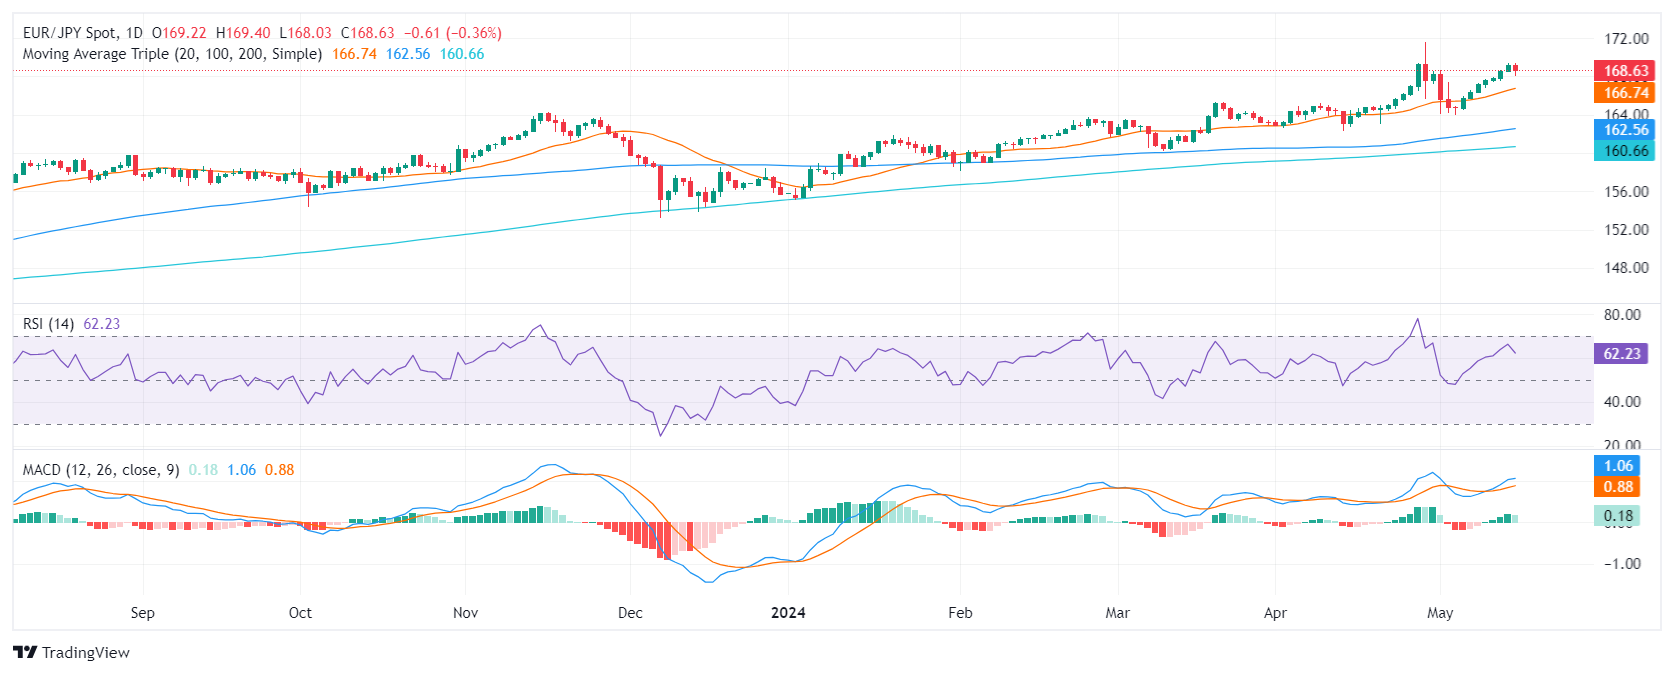
- The daily RSI shows strong buying momentum, deep in positive territory.
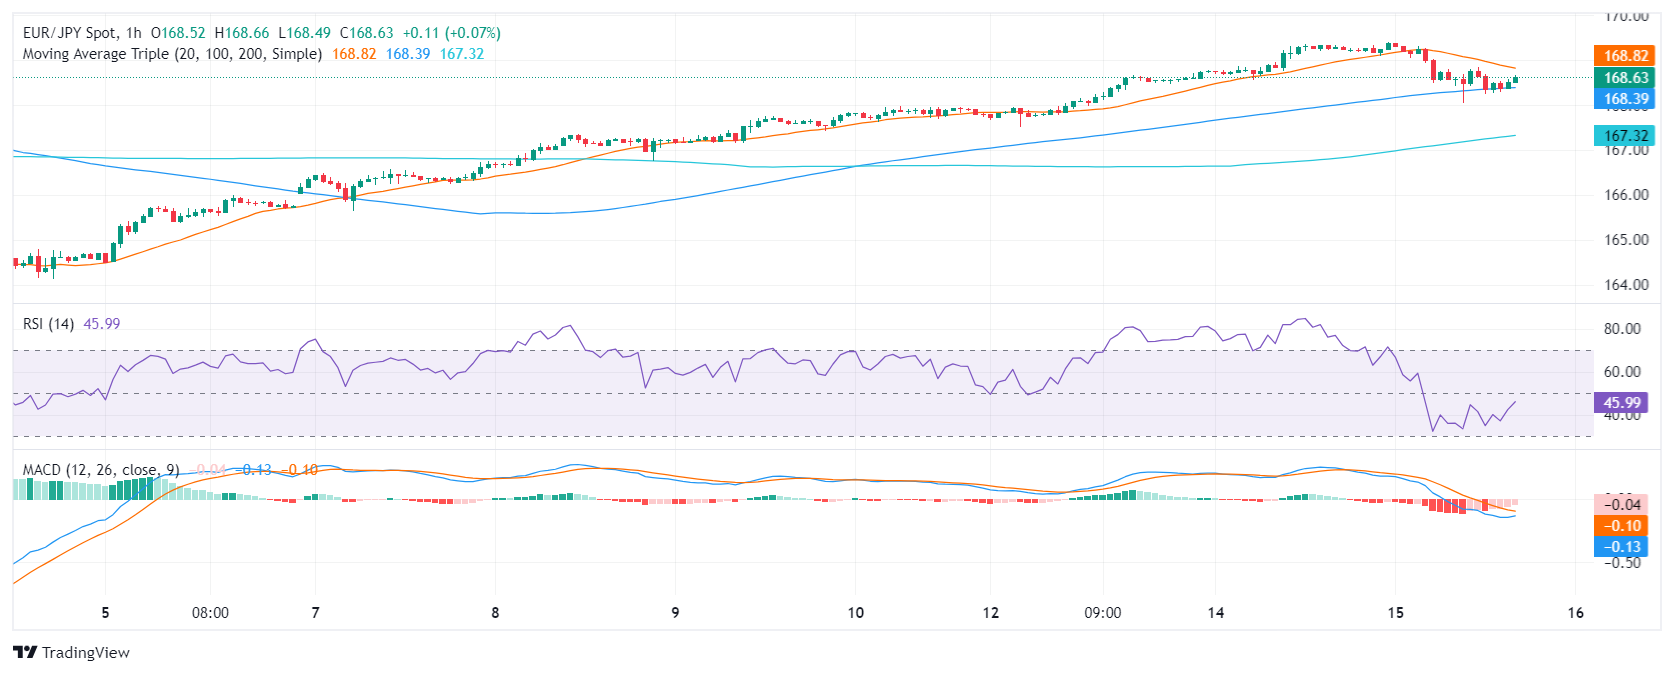
- Hourly chart displays a contrast, as RSI dips into the negative zone and MACD shows flat red bars, indicating short-term selling traction.
- As the pair approached cycle highs, a pause in the momentum seemed probable before a retest.
In Wednesday's session, the EUR/JPY pair maintains robust bullish momentum, despite encountering selling pressure and declining to 168.63. Despite brushing against highs around the 170.00 mark, investors temporarily halt, potentially indicating short-term consolidation and this pause could pave the way for further upward movements.
On the daily chart, the Relative Strength Index (RSI) stands in the positive territory, reflecting an upward momentum from bulls but points down indicating the mentioned halt in the bullish traction.
EUR/JPY daily chart

The hourly chart, in contrast, presents a weaker picture. The RSI dipped into the negative territory with the latest reading at 45. The Moving Average Convergence Divergence (MACD) remains bearish, printing flat red bars, suggesting short-term selling pressure. However, indicators seem to recover in this frame ahead of the Asian session.
EUR/JPY hourly chart

Reflecting on EUR/JPY's broader picture, it's in a bullish short- and long-term position as it stays above the 20, 100, and 200-day SMAs. This posture suggests a strong upward momentum for the pair, poised for continued bullishness.
In conclusion, while the overall technical outlook for EUR/JPY remains bullish based on the SMA analysis and daily chart, traders need to monitor the extent of the correction. Still, any movement that keeps the pair above its main SMAs wouldn’t threaten the positive outlook.
Information on these pages contains forward-looking statements that involve risks and uncertainties. Markets and instruments profiled on this page are for informational purposes only and should not in any way come across as a recommendation to buy or sell in these assets. You should do your own thorough research before making any investment decisions. FXStreet does not in any way guarantee that this information is free from mistakes, errors, or material misstatements. It also does not guarantee that this information is of a timely nature. Investing in Open Markets involves a great deal of risk, including the loss of all or a portion of your investment, as well as emotional distress. All risks, losses and costs associated with investing, including total loss of principal, are your responsibility. The views and opinions expressed in this article are those of the authors and do not necessarily reflect the official policy or position of FXStreet nor its advertisers. The author will not be held responsible for information that is found at the end of links posted on this page.
If not otherwise explicitly mentioned in the body of the article, at the time of writing, the author has no position in any stock mentioned in this article and no business relationship with any company mentioned. The author has not received compensation for writing this article, other than from FXStreet.
FXStreet and the author do not provide personalized recommendations. The author makes no representations as to the accuracy, completeness, or suitability of this information. FXStreet and the author will not be liable for any errors, omissions or any losses, injuries or damages arising from this information and its display or use. Errors and omissions excepted.
The author and FXStreet are not registered investment advisors and nothing in this article is intended to be investment advice.
Recommended content
Editors’ Picks

AUD/USD: Bulls continue to target 0.6300
AUD/USD traded in a tight range and faltered once again just ahead of the key 0.6300 hurdle on the back of the renewed buying interest in the US Dollar and the widespread knee-jerk in the risk complex.

EUR/USD: Further gains look at 1.0600 and above
The weekly recovery in EUR/USD gave signs of some loss of momentum despite the pair hit new three-week highs around 1.0460 in a context dominated by the resurgence of the bid bias around the Greenback.

Gold remains on track to challenge record peaks
Gold price sticks to positive bias for the third successive day on Wednesday and trades near its highest level since November 1 above $2,750. The uncertainty around US President Donald Trump's trade policies turns out to be a key factor that continues to drive haven flows towards the precious metal.

Dogecoin Price Prediction: Bulls target $0.40 rally as Trump officially launches Elon Musk’s DOGE
Dogecoin price rose 5% on Wednesday to reclaim $0.38 as Donald Trump signed the DOGE department into law. Media reports linking the Dogecoin logo to the official DOGE website sparked bullish speculations that a $0.50 breakout could be imminent.

Netflix posts record quarter, as Trump talks tariffs on China
There has been a positive tone to risk this week, as the market digests Trump 2.0. However, Trump is not the only show in town. Earnings reports are also a key driver of stock indices, and the news is good.

Trusted Broker Reviews for Smarter Trading
VERIFIED Discover in-depth reviews of reliable brokers. Compare features like spreads, leverage, and platforms. Find the perfect fit for your trading style, from CFDs to Forex pairs like EUR/USD and Gold.