|

EUR/JPY Price Analysis: Bulls lose traction, possible market cooling may follow

  • The daily RSI for EUR/JPY reveals a possible reduction in positive market momentum, signifying diminishing buyers' influence.
  • The hourly indicators suggest a growing selling pressure.

The EUR/JPY pair is trading at 164.25 and has decreased by 0.30% in Wednesday’s session. Despite being positioned above its key Simple Moving Averages (SMAs), the pair is experiencing a potential shift in momentum from bulls to bears with technical indicators losing traction.

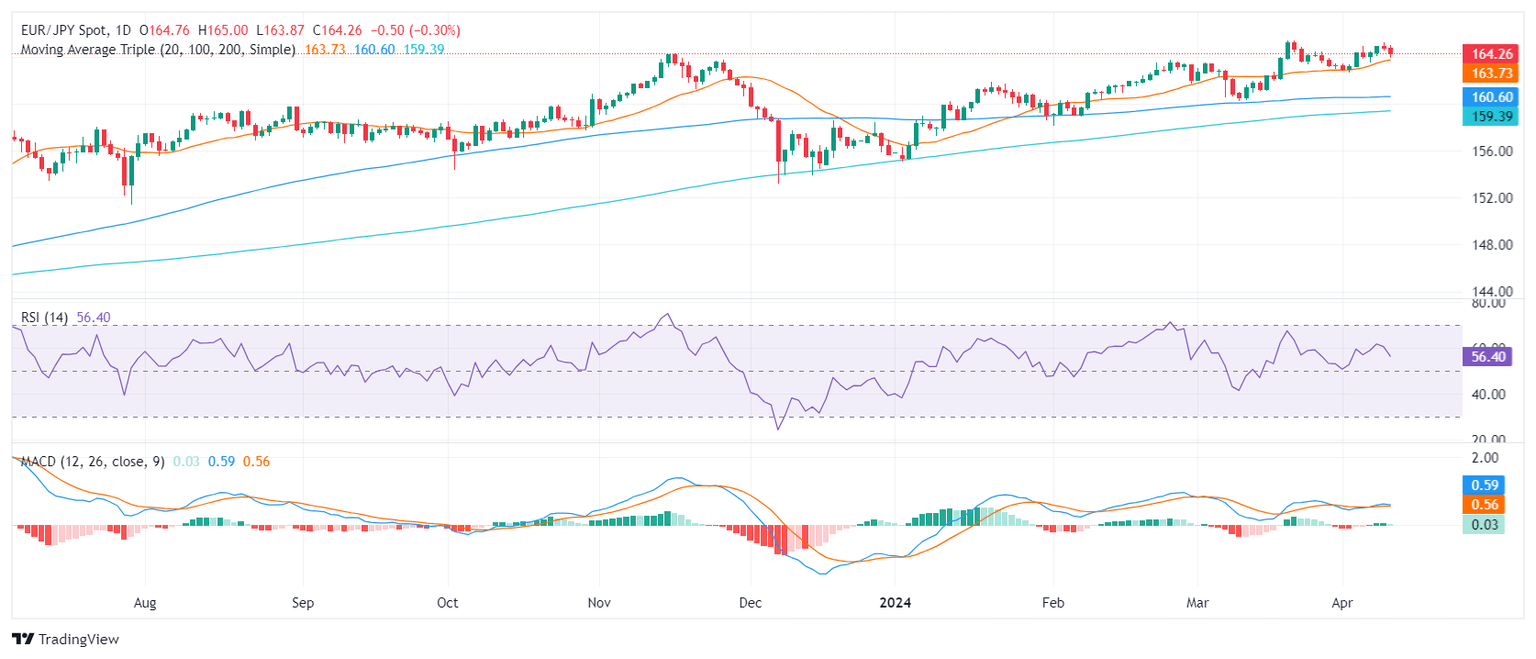
On the daily chart, the Relative Strength Index (RSI) for the pair is positioned in positive territory but points down. This, coupled with the sharp decrease in the green bars of the Moving Average Convergence Divergence (MACD), points to a possible reduction in positive market momentum. It indicates that the influence of buyers is potentially dwindling in the market. As such, the pair may start to cool off.

EUR/JPY daily chart

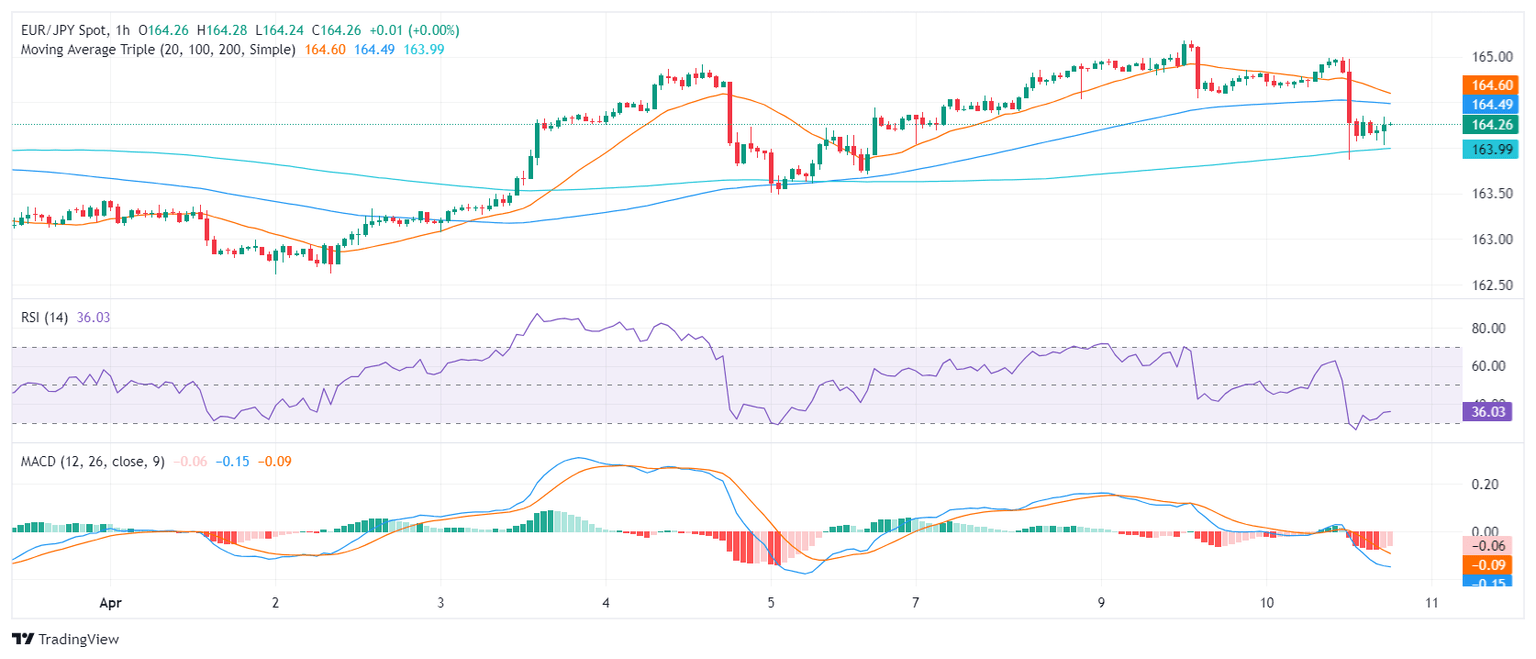
Zooming in, the hourly RSI value hovers mostly in the oversold region, with the latest value just above 30. Additionally, the MACD histogram on this timeframe presents rising red bars, showcasing an increase in negative momentum. This hints at a rise in sellers' dominance in the market.

EUR/JPY hourly chart

Inspecting the broader outlook, the EUR/JPY demonstrates considerably bullish signals. It stands above the 20-day, 100-day, and 200-day Simple Moving Averages (SMA). Such a position typically signifies a strong and resilient upward trend for both short-term and long-term scenarios. However, today's significant movements must be taken into account. Notably, the pair is challenging the 20-day SMA at the 163.72 mark. If the selling momentum grows and bears conquer the 20-day average, the pair may see further downside.

EUR/JPY

Overview
Today last price164.25
Today Daily Change-0.51
Today Daily Change %-0.31
Today daily open164.76
 
Trends
Daily SMA20163.6
Daily SMA50162.37
Daily SMA100160.59
Daily SMA200159.35
 
Levels
Previous Daily High165.18
Previous Daily Low164.54
Previous Weekly High164.92
Previous Weekly Low162.61
Previous Monthly High165.36
Previous Monthly Low160.22
Daily Fibonacci 38.2%164.78
Daily Fibonacci 61.8%164.93
Daily Pivot Point S1164.47
Daily Pivot Point S2164.18
Daily Pivot Point S3163.83
Daily Pivot Point R1165.11
Daily Pivot Point R2165.46
Daily Pivot Point R3165.75

Author

Patricio Martín

Patricio is an economist from Argentina passionate about global finance and understanding the daily movements of the markets.

More from Patricio Martín
Share:

Editor's Picks

EUR/USD struggles to regain momentum in the low1.1600s

EUR/USD is giving some signs of life in the aftermath of two severe days of losses on Wednesday, reclaiming the 1.1600 hurdle and above on the back of the resurgence of a mild selling bias around the US Dollar. Moving forward, the usual US weekly Claims will take centre stage on Thursday ahead of Friday’s crucial NFP data.
 

GBP/USD tests key moving averages as growth downgrade weighs

GBP/USD was nearly flat on Wednesday, edging up 0.08% to settle around 1.3370 in a quiet session. The pair has fallen sharply from its late-January high near 1.3870 and is now testing the 200-day Exponential Moving Average, with this week's one-week forex heatmap showing Pound Sterling as one of the worst performers against the US Dollar, down about 1.4% on the week.

Gold recovers modestly despite intensifying Middle East crisis

Gold keeps its daily gains well in place, although a break above the $5,200 mark per troy ounce still remains elusive on Wednesday. The yellow metal’s rebound comes in response to the persistent flight-to-safety amid intense geopolitical tensions in the Middle East and the bearish performance of the US Dollar.

Morgan Stanley files amended S-1 for spot Bitcoin ETF

Morgan Stanley submitted an amended S-1 filing to the US Securities and Exchange Commission on Wednesday, providing additional details on its proposed Bitcoin exchange-traded fund.

First Venezuela, now Iran: The US-China energy war escalates

At first glance, the latest escalation involving the United States with both Iran and Venezuela looks like another chapter in a long-running geopolitical story. But viewed through a broader strategic lens, something else may be unfolding: Energy.

Bittensor extends recovery despite retail demand slump

Bittensor, a leading Artificial Intelligence token, is aging up above $190 at the time of writing on Wednesday. Steady price increases characterise the broader crypto market, with Bitcoin holding above $71,000 and Ethereum above $2,000.