|

EUR/JPY Price Analysis: Bears keep resistance-turned-support surrounding mid-157.00s on table

  • EUR/JPY remains on back foot at weekly low, lacks momentum of late.
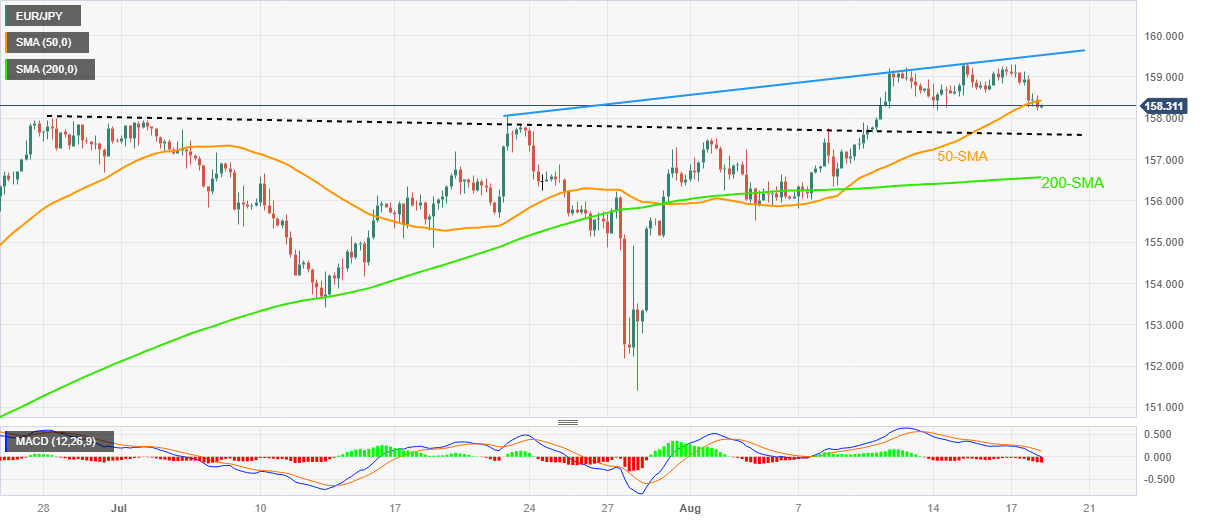
  • Clear break of 50-SMA, U-turn from ascending trend line and bearish MACD signals lure sellers.
  • Retreat in yields, firmer Japan inflation add strength to the pullback moves.
  • Seven-week-old previous resistance line prods cross-currency sellers ahead of 200-SMA support.

EUR/JPY holds lower ground at the intraday bottom of around 158.20 heading into Friday’s European session. In doing so, the cross-currency pair takes clues from the recent pullback in the Treasury bond yields, as well as upbeat prints of Japan’s inflation data, amid a sluggish trading day.

However, the pair’s clear U-turn from a three-week-old rising trend line and the bearish MACD signals, as well as a downside break of the 50-SMA, gain major attention to keep the sellers hopeful.

It’s worth noting that the previous resistance line from late June restricts the immediate downside of the EUR/JPY pair to around 157.60.

Following that, the 200-SMA level surrounding 156.55 will act as the final defense of the EUR/JPY buyers.

In a case where the quote remains bearish past 156.55, multiple supports around 155.50 and 153.40 may prod the sellers before directing them to the previous monthly low of around 151.40.

On the contrary, a clear upside break of the 50-SMA level of 158.45 becomes necessary for the EUR/JPY buyer’s return.

Even so, an ascending trend line from July 21, close to 159.55, quickly followed by the 160.00 round figure, will challenge the EUR/JPY bulls afterward.

EUR/JPY: Four-hour chart

Trend: Further downside expected

Additional important levels

Overview
Today last price158.28
Today Daily Change-0.28
Today Daily Change %-0.18%
Today daily open158.56
 
Trends
Daily SMA20157.09
Daily SMA50156.06
Daily SMA100152
Daily SMA200147.27
 
Levels
Previous Daily High159.3
Previous Daily Low158.26
Previous Weekly High159.22
Previous Weekly Low155.81
Previous Monthly High158.05
Previous Monthly Low151.41
Daily Fibonacci 38.2%158.65
Daily Fibonacci 61.8%158.9
Daily Pivot Point S1158.11
Daily Pivot Point S2157.66
Daily Pivot Point S3157.07
Daily Pivot Point R1159.16
Daily Pivot Point R2159.75
Daily Pivot Point R3160.2

Author

Anil Panchal

Anil Panchal

FXStreet

Anil Panchal has nearly 15 years of experience in tracking financial markets. With a keen interest in macroeconomics, Anil aptly tracks global news/updates and stays well-informed about the global financial moves and their implications.

More from Anil Panchal
Share:

Editor's Picks

EUR/USD stays weak near 1.1850 after dismal German ZEW data

EUR/USD remains in the red near 1.1850 in the European session on Tuesday. A broad US Dollar bullish consolidation combined with a softer risk tone keep the pair undermined alongside downbeat German ZEW sentiment readings for February. 

GBP/USD holds losees near 1.3600 after weak UK jobs report

GBP/USD is holding moderate losses near the 1.3600 level in Tuesday's European trading. The United Kingdom employment data suggested worsening labor market conditions, bolstering bets for a BoE interest rate cut next month. This narrative keeps the Pound Sterling under bearish pressure. 

Gold pares intraday losses; keeps the red above $4,900 amid receding safe-haven demand

Gold (XAU/USD) attracts some follow-through selling for the second straight day and dives to over a one-week low, around the $4,858 area, heading into the European session on Tuesday. 

Canada CPI expected to show sticky inflation in January, still above BoC’s target

Economists see the headline CPI rising by 2.4% in a year to January, still above the BoC’s target and matching December’s increase. On a monthly basis, prices are expected to rise by 0.1%.

UK jobs market weakens, bolstering rate cut hopes

In the UK, the latest jobs report made for difficult reading. Nonetheless, this represents yet another reminder for the Bank of England that they need to act swiftly given the collapse in inflation expected over the coming months. 

Stellar mixed sentiment caps recovery

Stellar price remains under pressure, trading at $0.170 on Tuesday after failing to close above the key resistance on Sunday. The derivatives metric supports the bearish sentiment, with XLM’s short bets rising among traders and funding rates turning negative.