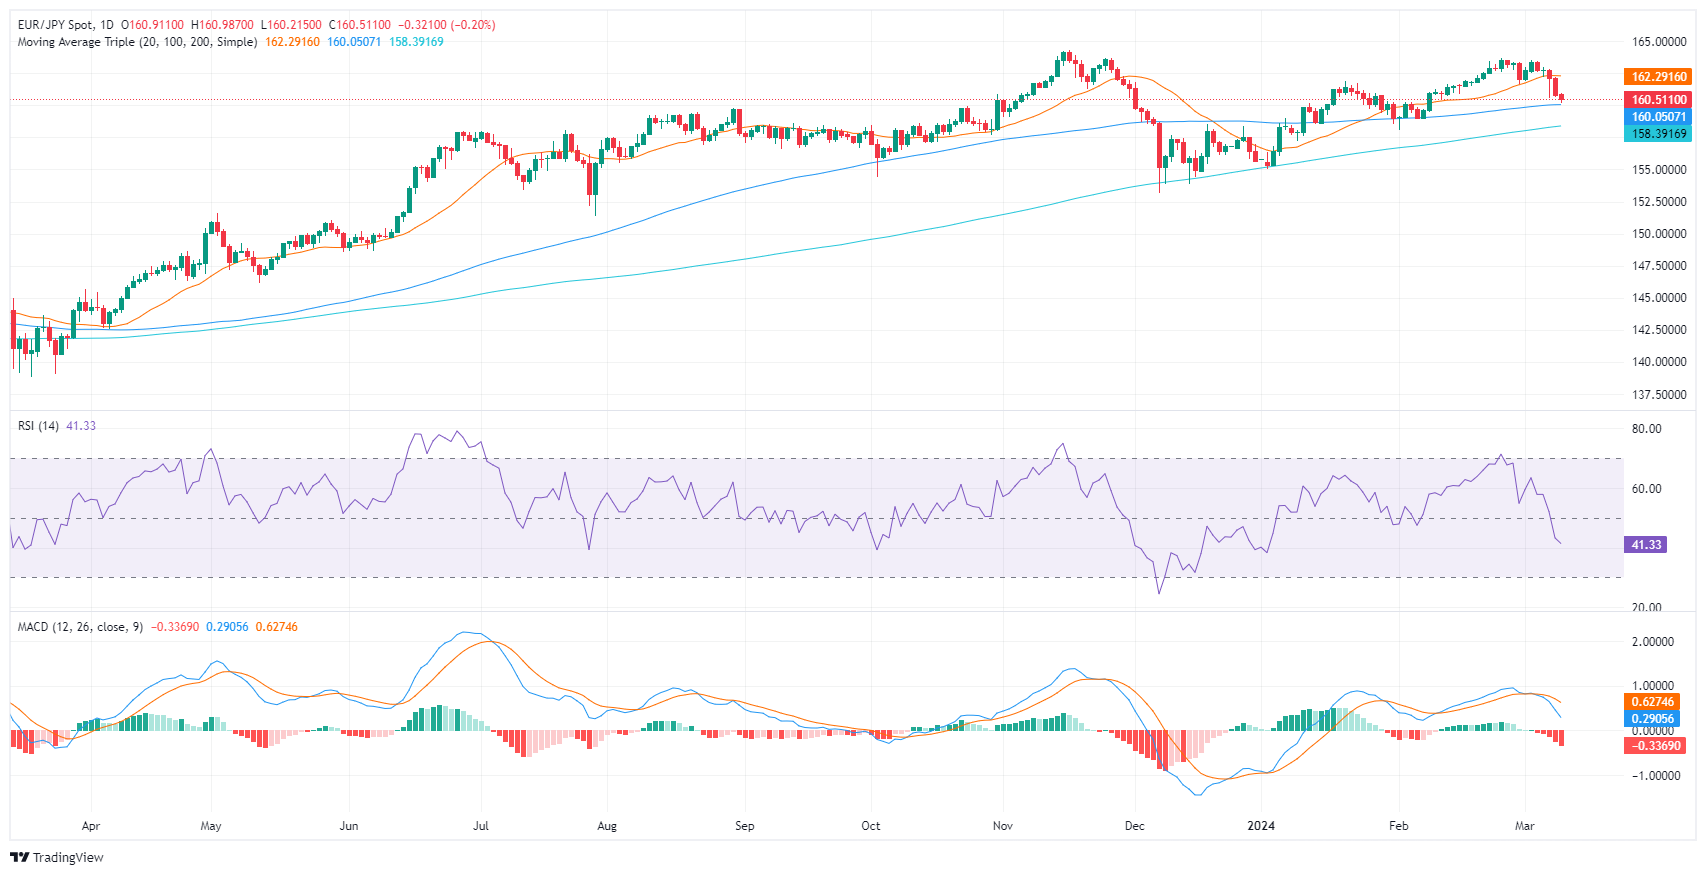
- Daily chart analysis reveals heightened selling pressure with the RSI and MACD deep in the negative zone.
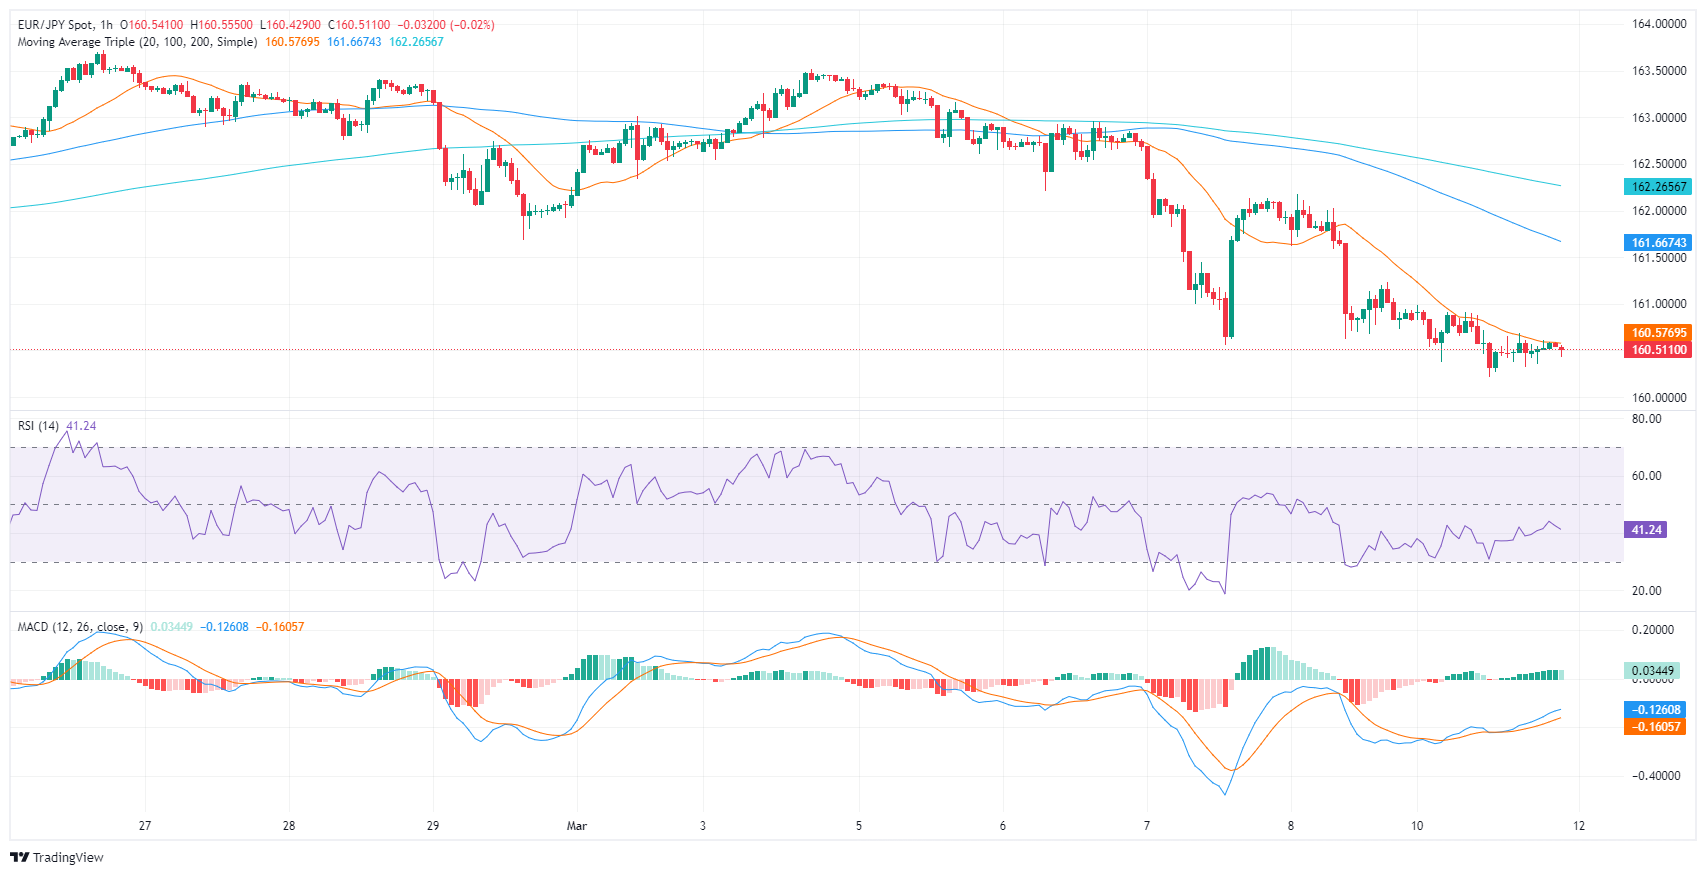
- The hourly chart saw a short-lived recovery in the indicators.
- Although the pair has experienced recent declines, its positioning above the key SMAs signals an ongoing bullish outlook.
In Monday's session, the EUR/JPY pair is trading at 160.57, showing a daily decrease of 0.19%. Despite ongoing fluctuations, it is currently observed that the sellers are moderating the buyers' strength. A short-lived recovery seen in the shorter time frames seems to be waning.
On the daily chart, the Relative Strength Index (RSI) measures around 41, indicating strong selling pressure. A downtrend was noted from being in positive territory a week ago at a peak of approximately 65 as the seller seized control. Concurrently, the Moving Average Convergence Divergence (MACD) histogram is witnessing rising red bars, interpreting a growth in negative momentum.
EUR/JPY daily chart

Moving to the hourly chart of EUR/JPY, the RSI is almost equivalent to the daily chart showing an RSI of around 40 after hitting oversold conditions earlier in the session. The MACD histogram depicts decreasing green bars, indicating that the built buying momentum is declining.
EUR/JPY hourly chart

In the larger picture, the EUR/JPY pair, despite recently losing ground, remains above the 100 and 200-day Simple Moving Averages (SMAs). This suggests that on larger time frames, bullish sentiment persists.
Information on these pages contains forward-looking statements that involve risks and uncertainties. Markets and instruments profiled on this page are for informational purposes only and should not in any way come across as a recommendation to buy or sell in these assets. You should do your own thorough research before making any investment decisions. FXStreet does not in any way guarantee that this information is free from mistakes, errors, or material misstatements. It also does not guarantee that this information is of a timely nature. Investing in Open Markets involves a great deal of risk, including the loss of all or a portion of your investment, as well as emotional distress. All risks, losses and costs associated with investing, including total loss of principal, are your responsibility. The views and opinions expressed in this article are those of the authors and do not necessarily reflect the official policy or position of FXStreet nor its advertisers. The author will not be held responsible for information that is found at the end of links posted on this page.
If not otherwise explicitly mentioned in the body of the article, at the time of writing, the author has no position in any stock mentioned in this article and no business relationship with any company mentioned. The author has not received compensation for writing this article, other than from FXStreet.
FXStreet and the author do not provide personalized recommendations. The author makes no representations as to the accuracy, completeness, or suitability of this information. FXStreet and the author will not be liable for any errors, omissions or any losses, injuries or damages arising from this information and its display or use. Errors and omissions excepted.
The author and FXStreet are not registered investment advisors and nothing in this article is intended to be investment advice.
Recommended content
Editors’ Picks
EUR/USD climbs above 1.0800 as weak PMI data weighs on USD

EUR/USD preserves its bullish momentum and trades at its highest level in nearly three weeks above 1.0800 in the American session. The US Dollar stays under heavy selling pressure following the disappointing ADP and PMI data, fuelling the pair's rally.
GBP/USD extends rally toward 1.2800 as USD selloff continues

GBP/USD continues to push higher toward 1.2800 and trades at its highest level since mid-June on Wednesday. The disappointing ISM Services PMI data from the US weighs heavily on the US Dollar and allows the pair to target new multi-week tops.
Gold jumps above $2,360 after dismal US data

Gold gathers bullish momentum and trades at its highest level in nearly two weeks above $2,360. Following the disappointing ADP Employment Change and ISM Services PMI data from the US, the 10-year US yield declines sharply, helping XAU/USD extend its daily rally.
Crypto Today: Bitcoin erases gains from end of June, Ethereum declines while Ripple holds

Bitcoin wipes out gains from the last week of June and falls below $60,000 on Wednesday. Ethereum and top altcoins ranked by market capitalization erased gains as the inflation outlook worsened.
Fed Minutes Preview: Markets to focus on cues regarding the inflation outlook

The Minutes of the Fed’s June 11-12 policy meeting will be published on Wednesday. Details of Jerome Powell and Co’s hawkish hold and their inflation outlook will be scrutinized.