|

EUR/JPY Price Analysis: A pullback on the cards, as negative divergence and a rising-wedge lurks

  • The EUR/JPY remains intact, but the divergence between price action/RSI might open the door for a pullback.
  • Also, the EUR/JPY daily chart shows price action meandering within a rising wedge, which suggests the Euro might weaken vs. the Japanes Yen.

The EUR/JPY extends to two-day of losses amidst a risk-off impulse as witnessed by Wall Street’s finishing with losses. Meanwhile, as the Asian Pacific session begins, the EUR/JPY is trading at 146.42, registering minuscule gains of 0.04%.

EUR/JPY Price Analysis: Technical outlook

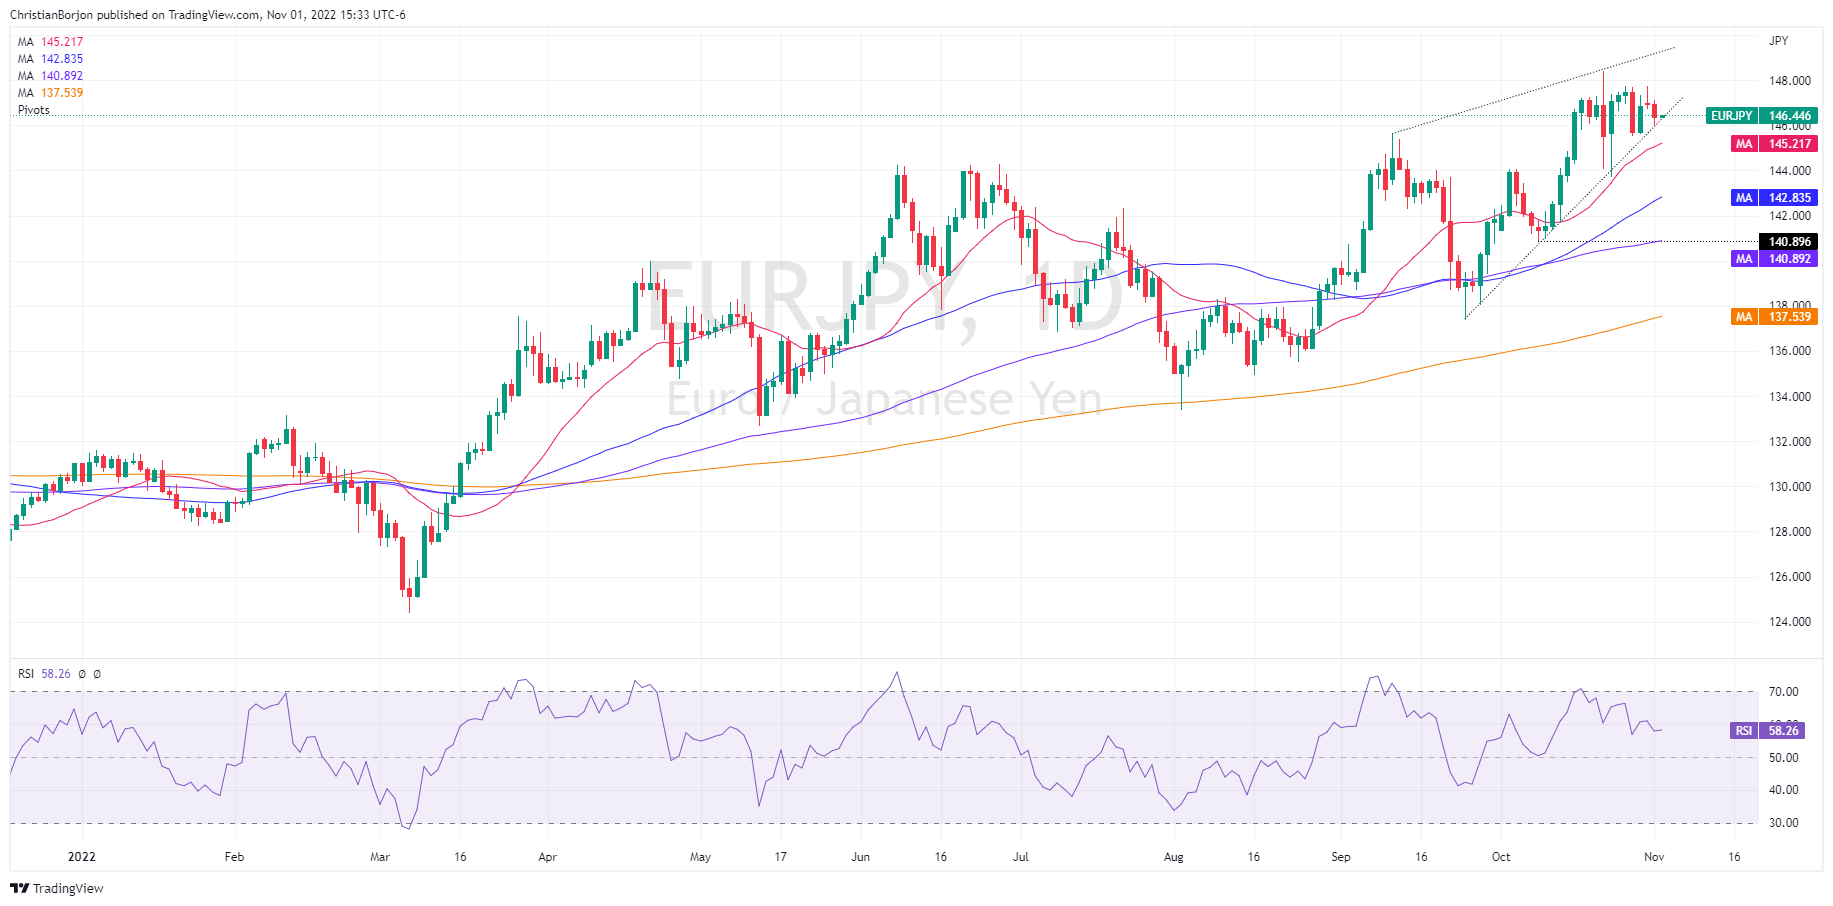
While the EUR/JPY retreated from weekly highs around 147.75, as shown by the daily chart, the uptrend remains intact – for now. However, the emergence of a rising wedge, lays the ground for a pullback, at least to the 20-day Exponential Moving Average (EMA) at 145.21, ahead of critical support reached on October 24, following the Bank of Japan (BoJ) FX intervention at 143.72, shy of the 144.00 figure.

The Relative Strength Index (RSI) has reached a successive series of lower highs, contrarily to price action. So two technical indicators namely the rising wedge and divergence between the EUR/JPY price action and RSI, suggest that sellers are gathering momentum.

EUR/JPY Key Technical Levels

EUR/JPY

Overview
Today last price146.5
Today Daily Change-0.44
Today Daily Change %-0.30
Today daily open146.94
 
Trends
Daily SMA20144.99
Daily SMA50142.5
Daily SMA100140.82
Daily SMA200137.4
 
Levels
Previous Daily High147.76
Previous Daily Low146.71
Previous Weekly High147.72
Previous Weekly Low143.73
Previous Monthly High148.4
Previous Monthly Low140.9
Daily Fibonacci 38.2%147.11
Daily Fibonacci 61.8%147.36
Daily Pivot Point S1146.51
Daily Pivot Point S2146.09
Daily Pivot Point S3145.47
Daily Pivot Point R1147.56
Daily Pivot Point R2148.18
Daily Pivot Point R3148.6

Author

Christian Borjon Valencia

Markets analyst, news editor, and trading instructor with over 14 years of experience across FX, commodities, US equity indices, and global macro markets.

More from Christian Borjon Valencia
Share:

Editor's Picks

EUR/USD eases marginally, back to 1.1800

EUR/USD navigates a narrow range on Thursday, hovering around the 1.1800 neighbourhood in a context of humble gains in the US Dollar. The pair’s lacklustre performance come amid the unabated trade uncertainty, geopolitical tensions in the Middle East and the cautious tone from the ECB’s Lagarde.

GBP/USD retreats from tops, approaching 1.3540

GBP/USD partially sets aside Wednesday’s strong advance and recedes to the 1.3540 region on Thursday. Cable’s modest retracement follows the equally acceptable gains in the Greenback, while investors continue to pencil in a potential BoE rate cut in March.

Gold clings to gains just below $5,200, focus on geopolitics

Gold is edging modestly higher on Thursday, adding to Wednesday’s uptick and holding just below the $5,200 mark per troy ounce against the backdrop of modest gains in the US Dollar. In the meantime, attention is turning to the geopolitical scenario following US-Iran nuclear talks.

Stellar: Relief bounce fades as bearish undertone persists

Stellar is trading around $0.16 at the time of writing on Thursday after rebounding more than 8% in the previous day. Derivatives data paints a negative picture as XLM’s short bets hit a monthly high while Open Interest continues to decline.

The one thing everyone is on the lookout for is US action of some sort against Iran

The FX market is minestrone soup these days. It is befuddled by conflicting data, rumors and small stories exaggerated out of proportion, and Trump-generated uncertainty. 

Bitcoin steadies as traders eye US–Iran talks

Bitcoin (BTC) price is stabilizing around $68,000 at the time of writing on Thursday after a 6.2% relief rally the previous day amid a broader downward trend.