|

EUR/GBP technical analysis: Euro breaks above 0.8700 the figure nearing 2-month highs
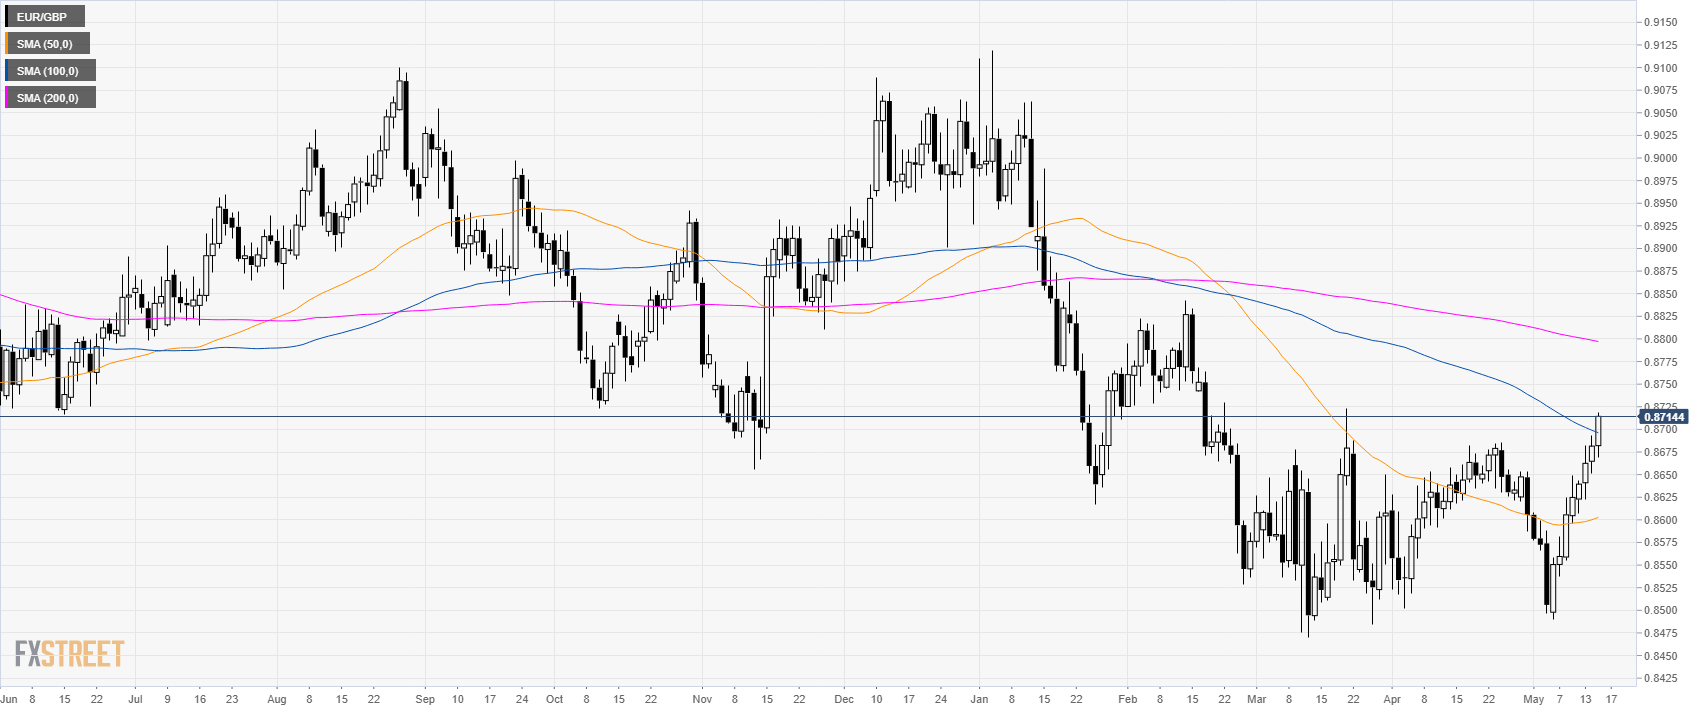
EUR/GBP daily

On the daily chart, EUR/GBP is trading in a bull leg now surpassing the 100 simple moving average (SMAs).
EUR/GBP is reversing up sharply from the 2019 low as it has been up for 8 consecutive days.

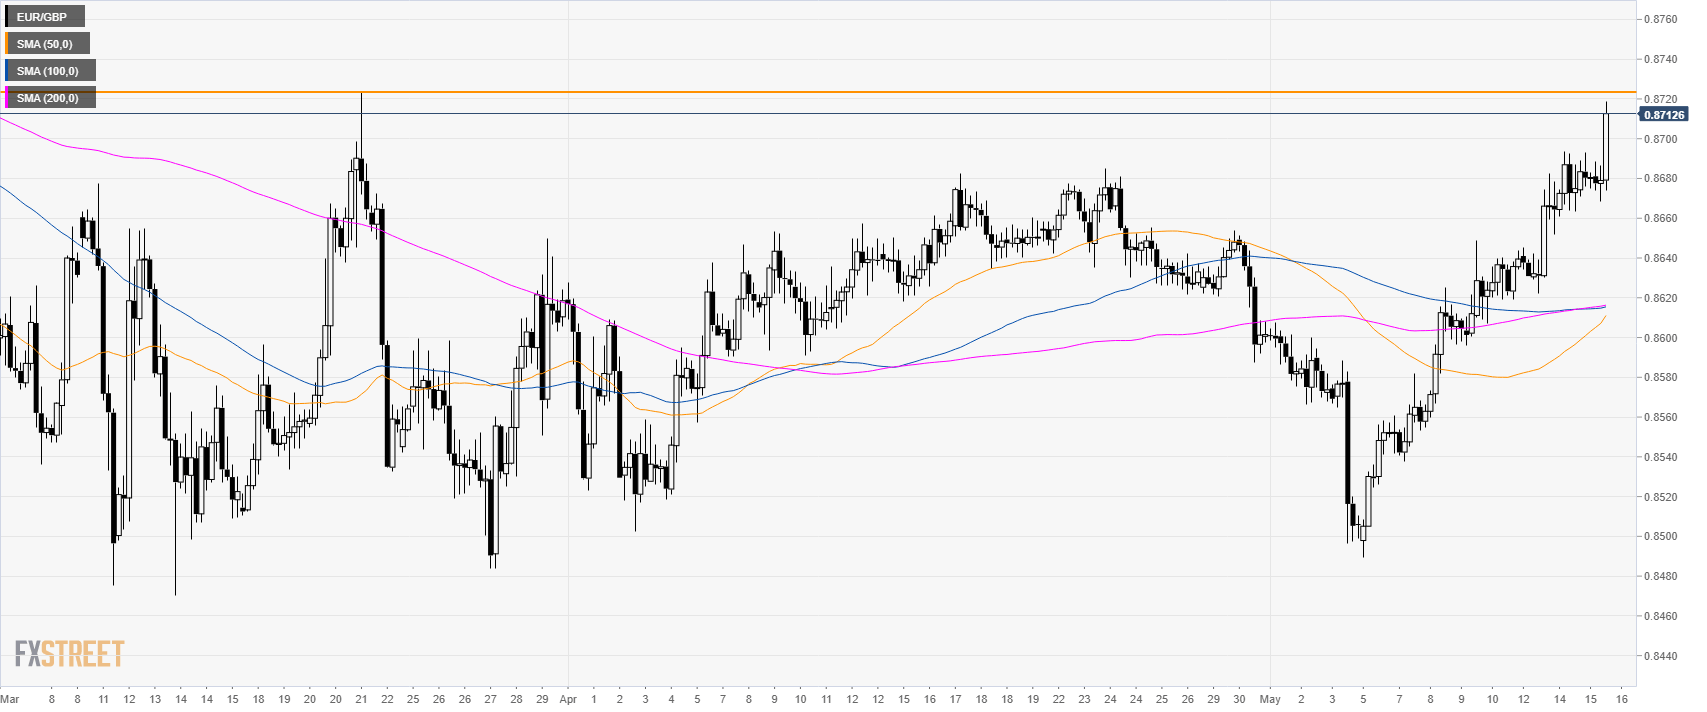
EUR/GBP 4-hour chart


EUR/GBP is challenging March’s high (0.8723) as it broke above the 0.8700 figure.

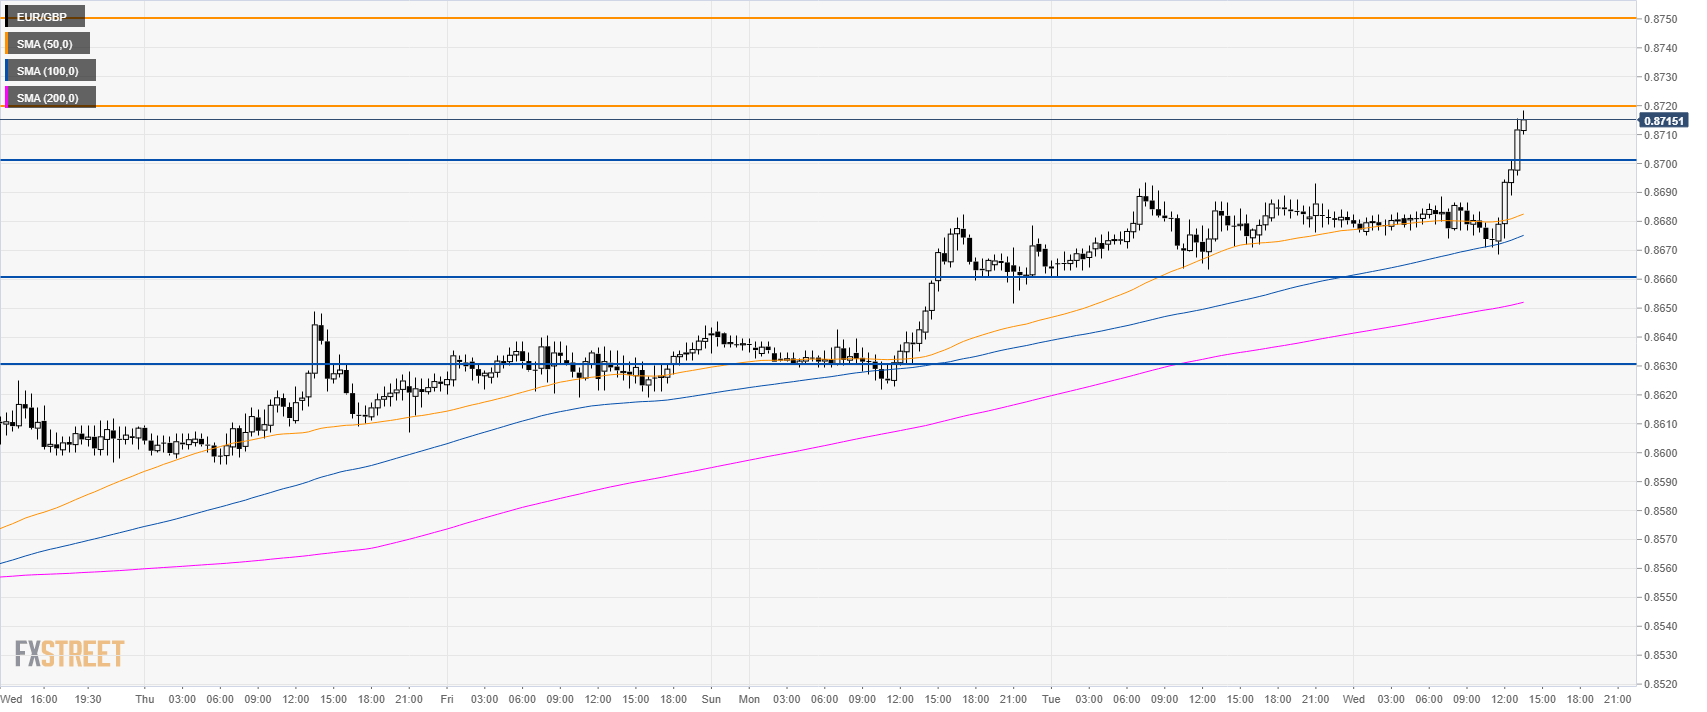
EUR/GBP 30-minute chart

EUR/GBP is trading above its main SMAs suggesting bullish momentum. The next hurdle for buyers is seen at the 0.8720 level. If broken, bulls might set their eyes on 0.8750 level resistance.
Support is at 0.8700 and 0.8660 level.

Additional key levels

EUR/GBP

Overview
Today last price0.8714
Today Daily Change0.0032
Today Daily Change %0.37
Today daily open0.8682
 
Trends
Daily SMA200.8623
Daily SMA500.86
Daily SMA1000.8699
Daily SMA2000.8799
Levels
Previous Daily High0.8694
Previous Daily Low0.8652
Previous Weekly High0.8649
Previous Weekly Low0.8489
Previous Monthly High0.8685
Previous Monthly Low0.8502
Daily Fibonacci 38.2%0.8677
Daily Fibonacci 61.8%0.8668
Daily Pivot Point S10.8658
Daily Pivot Point S20.8634
Daily Pivot Point S30.8616
Daily Pivot Point R10.8699
Daily Pivot Point R20.8717
Daily Pivot Point R30.8741

Author

Flavio Tosti

Flavio Tosti

Independent Analyst


More from Flavio Tosti
Share:

Editor's Picks

EUR/USD: Breakdown below trading range support near 1.1770 comes into play

The EUR/USD pair opens with a bearish gap at the start of a new week as the US-Iran war-led global flight to safety boosts the US Dollar. Spot prices, however, lack follow-through selling and manage to hold above mid-1.1700s during the Asian session.

GBP/USD targets 1.3500 barrier near moving averages

GBP/USD rebounds from the daily losses, trading around 1.3450 during the Asian hours on Monday. The technical analysis of the daily chart indicates an ongoing bearish bias, as the pair trades within a descending channel pattern.

Gold retreats from $5,400; still up over 1% amid Middle East tensions

Gold retreats from the $5,400 neighborhood, or its highest level since late January, touched in the Asian session on Monday, though it manages to hold above the $5,300 round figure. The bright metal opened with a bullish gap of about $17 and rallied toward the $5,400 level as Asian traders hit their desks and reacted negatively to the weekend news of the US and Israel attacks on Iran, rushing for cover in Gold.

Top Crypto Losers: Tezos, Toncoin, and Polkadot at crucial levels amid US-Israel strike on Iran

Altcoins such as Tezos, Toncoin, and Polkadot rank among the worst hit cryptocurrencies over the last 24 hours amid the US and Israel's attack on Iran. Tezos and Toncoin are down to crucial support levels while Polkadot remains near a crucial resistance trendline, showcasing underlying strength.

The market is paying for insurance, not apocalypse

As expected, this morning felt less like a Monday market open and more like a fire drill. Futures screens flickered red. S&P contracts down almost 1%. Nasdaq off 1.2%. Brent leaped 13% through $80. Gold rose 1.6% toward $5350 before paring some gains. The dollar is strutting mildly. The Swiss franc is quietly doing what it always does in a storm, catching some safe-haven flows.

Starknet unveils strkBTC, shielded Bitcoin transactions on Ethereum Layer 2

Starknet, the Ethereum Layer 2 network developed by StarkWare, today announced strkBTC, a wrapped Bitcoin asset that introduces optional shielding while preserving full DeFi composability.