- EUR/GBP is in a sideways trend that has lasted for three months.
- This trend is expected to extend, but at what point would a breakout from the range be assessed as occurring?
- How far would such breakouts be expected to travel?
EUR/GBP price is in a sideways trend which has unfolded over three months. In technical analysis the received wisdom is that the existing trend is expected to continue until the weight of evidence points to a reversal. Since there is no evidence EUR/GBP has changed trend the conclusion must be that it will continue trading sideways.
However, it is a useful exercise to estimate at what levels the sideways trend will have been assessed as ending and a new bullish or bearish trend said to have begun.
EUR/GBP 4-hour Chart
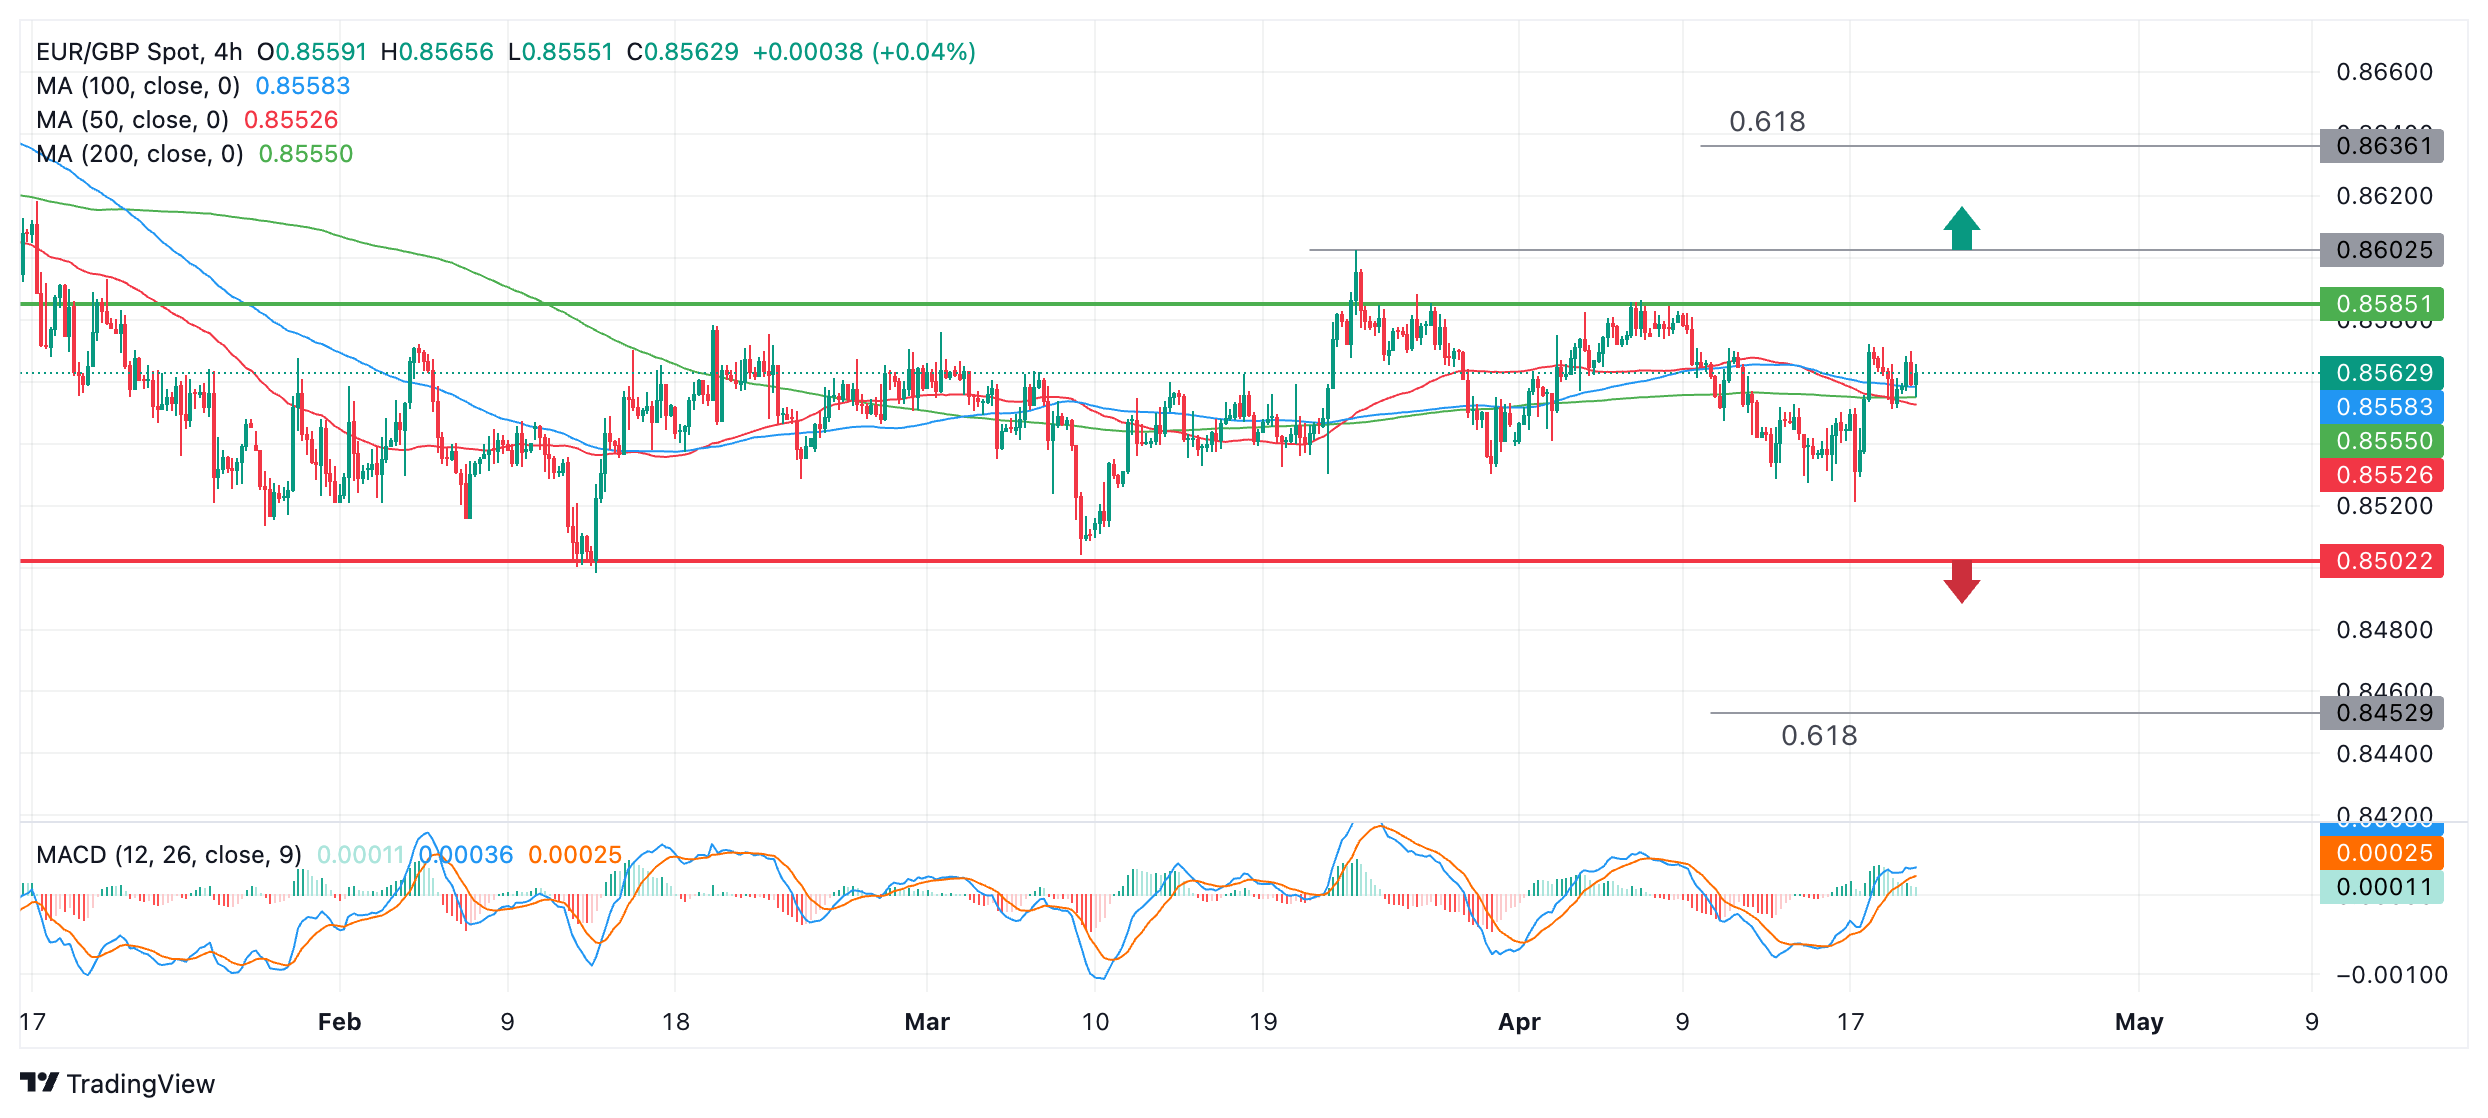
One method to achieve this is to establish the levels of the ceiling and floor of the range. If price breaks above or below these levels it will probably indicate the trend has changed. An upside breakout will probably indicate a new bull trend is starting and vice versa for a downside breakout.
Although the range formed by EUR/GBP’s does not appear to have exact high and low boundaries, it is possible to make a rough estimate of where the ceiling and the floor lie.
The floor is easier to estimate since there have been two swing lows that have bottomed at the same level, 0.8502. This is illustrated by the horizontal red line on the chart above.
The range ceiling is less clearly defined. The very highest peak in the sideways market was achieved on March 22 at 0.8602 (circled).
Another level that could be a ceiling is at 0.8585 where price has topped on two separate occasions (green horizontal line) and even 0.8571 where price has touched multiple times (green dotted line).
Which of the three should be chosen is a matter of choice. It is a tenet of technical analysis, however, that a level gains importance the more times it is tested, and so the hypothetical ceiling should at least have been touched more than once.
This rules out the March 22 high, which was only reached once. The next level at 0.8585 offers a good compromise as it has been touched twice and lies between the 0.8602 peak of the range and the 0.8571 multiple-touch level. It is this midpoint level which has been chosen for this analysis.
When price breaks out of a range it usually travels a distance that can be roughly worked out based on the height of the range. The conservative target for how far a breakout will travel is to take the 0.681 Fibonacci ratio of the height of the range and extrapolate it from the boundary higher or lower.
Based on this forecasting method, a breakout above the ceiling of the range at 0.8585 would be expected to travel to a target at 0.8636. A breakout from the bottom of the range, meanwhile, would be forecast to travel to a target at 0.8453.
These moves would constitute considerable deviations from the central tendency of the range and probably, therefore, also indicate a change in the short-term trend – from sideways to bullish for a break higher, and sideways to bearish for a break lower. As such they provide key evidence for assessing whether the trend may have changed.
A break above the March 22 peak would provide added confirmation of an upside break as there is always a risk price could retest the level and then fall back down into the range.
To avoid false breakout signals, only decisive breaks above or below the range high or low should be counted as indicating a valid breakout. A decisive break would be one characterized by a longer-than-average daily candlestick that pierces the floor or ceiling and closes near its low or high respectively, or three candlesticks in a row that pierce above or below the level.
Information on these pages contains forward-looking statements that involve risks and uncertainties. Markets and instruments profiled on this page are for informational purposes only and should not in any way come across as a recommendation to buy or sell in these assets. You should do your own thorough research before making any investment decisions. FXStreet does not in any way guarantee that this information is free from mistakes, errors, or material misstatements. It also does not guarantee that this information is of a timely nature. Investing in Open Markets involves a great deal of risk, including the loss of all or a portion of your investment, as well as emotional distress. All risks, losses and costs associated with investing, including total loss of principal, are your responsibility. The views and opinions expressed in this article are those of the authors and do not necessarily reflect the official policy or position of FXStreet nor its advertisers. The author will not be held responsible for information that is found at the end of links posted on this page.
If not otherwise explicitly mentioned in the body of the article, at the time of writing, the author has no position in any stock mentioned in this article and no business relationship with any company mentioned. The author has not received compensation for writing this article, other than from FXStreet.
FXStreet and the author do not provide personalized recommendations. The author makes no representations as to the accuracy, completeness, or suitability of this information. FXStreet and the author will not be liable for any errors, omissions or any losses, injuries or damages arising from this information and its display or use. Errors and omissions excepted.
The author and FXStreet are not registered investment advisors and nothing in this article is intended to be investment advice.


Recommended content
Editors’ Picks

EUR/USD consolidates gains below 1.1400 on weaker US Dollar
EUR/USD consolidates its recovery gains below 1.1400 in early Europe on Monday. Upbeat risk sentiment on Trump's tairff concession news fails to lift the US Dollar, supporting the pair. US-China trade headlines will continue to dominate ahead of Fedspeak.

GBP/USD holds above 1.3100 as USD sellers refuse to give up
GBP/USD preserves its bullish momentum and regains the 1.3100 mark in the European morning on Monday. The sustained US Dollar weakness suggests that the path of least resistance for the pair remains to the upside. US-China trade updates remain in focus.

Gold price extends its consolidative price move near record high; rising US-China trade tensions favor bulls
Gold price trades with a mild negative bias just below a fresh all-time peak touched during the Asian session on Monday as bulls pause for a breather amid slightly overbought conditions on the daily chart. Furthermore, a further recovery in the global risk sentiment contributes to capping the upside for the commodity.

TRUMP token leads $906 million in unlocks this week with over $330 million release
According to Tokenomist, 15 altcoins will unlock more than $5 million each in the next 7 days. Wu Blockchain data shows that the total unlocked value exceeds $906 million, of which the TRUMP token will unlock more than $330 million.

Is a recession looming?
Wall Street skyrockets after Trump announces tariff delay. But gains remain limited as Trade War with China continues. Recession odds have eased, but investors remain fearful. The worst may not be over, deeper market wounds still possible.

The Best brokers to trade EUR/USD
SPONSORED Discover the top brokers for trading EUR/USD in 2025. Our list features brokers with competitive spreads, fast execution, and powerful platforms. Whether you're a beginner or an expert, find the right partner to navigate the dynamic Forex market.