EUR/GBP Price Analysis: Trading back inside medium-term range
- EUR/GBP is trading back inside a multi-month range after temporarily breaking out to the upside.
- It could now potentially continue falling to the range lows, with support from 50 and 100 MAs on the way.
- The pair is in a sideways trend that continues extending.
EUR/GBP has fallen back inside its multi-month range after temporarily breaking out to the upside on May 7.
The move back down inside the range continues the pair’s sideways trend. This trend is expected to continue given the old saying that “the trend is your friend”.
EUR/GBP Daily Chart
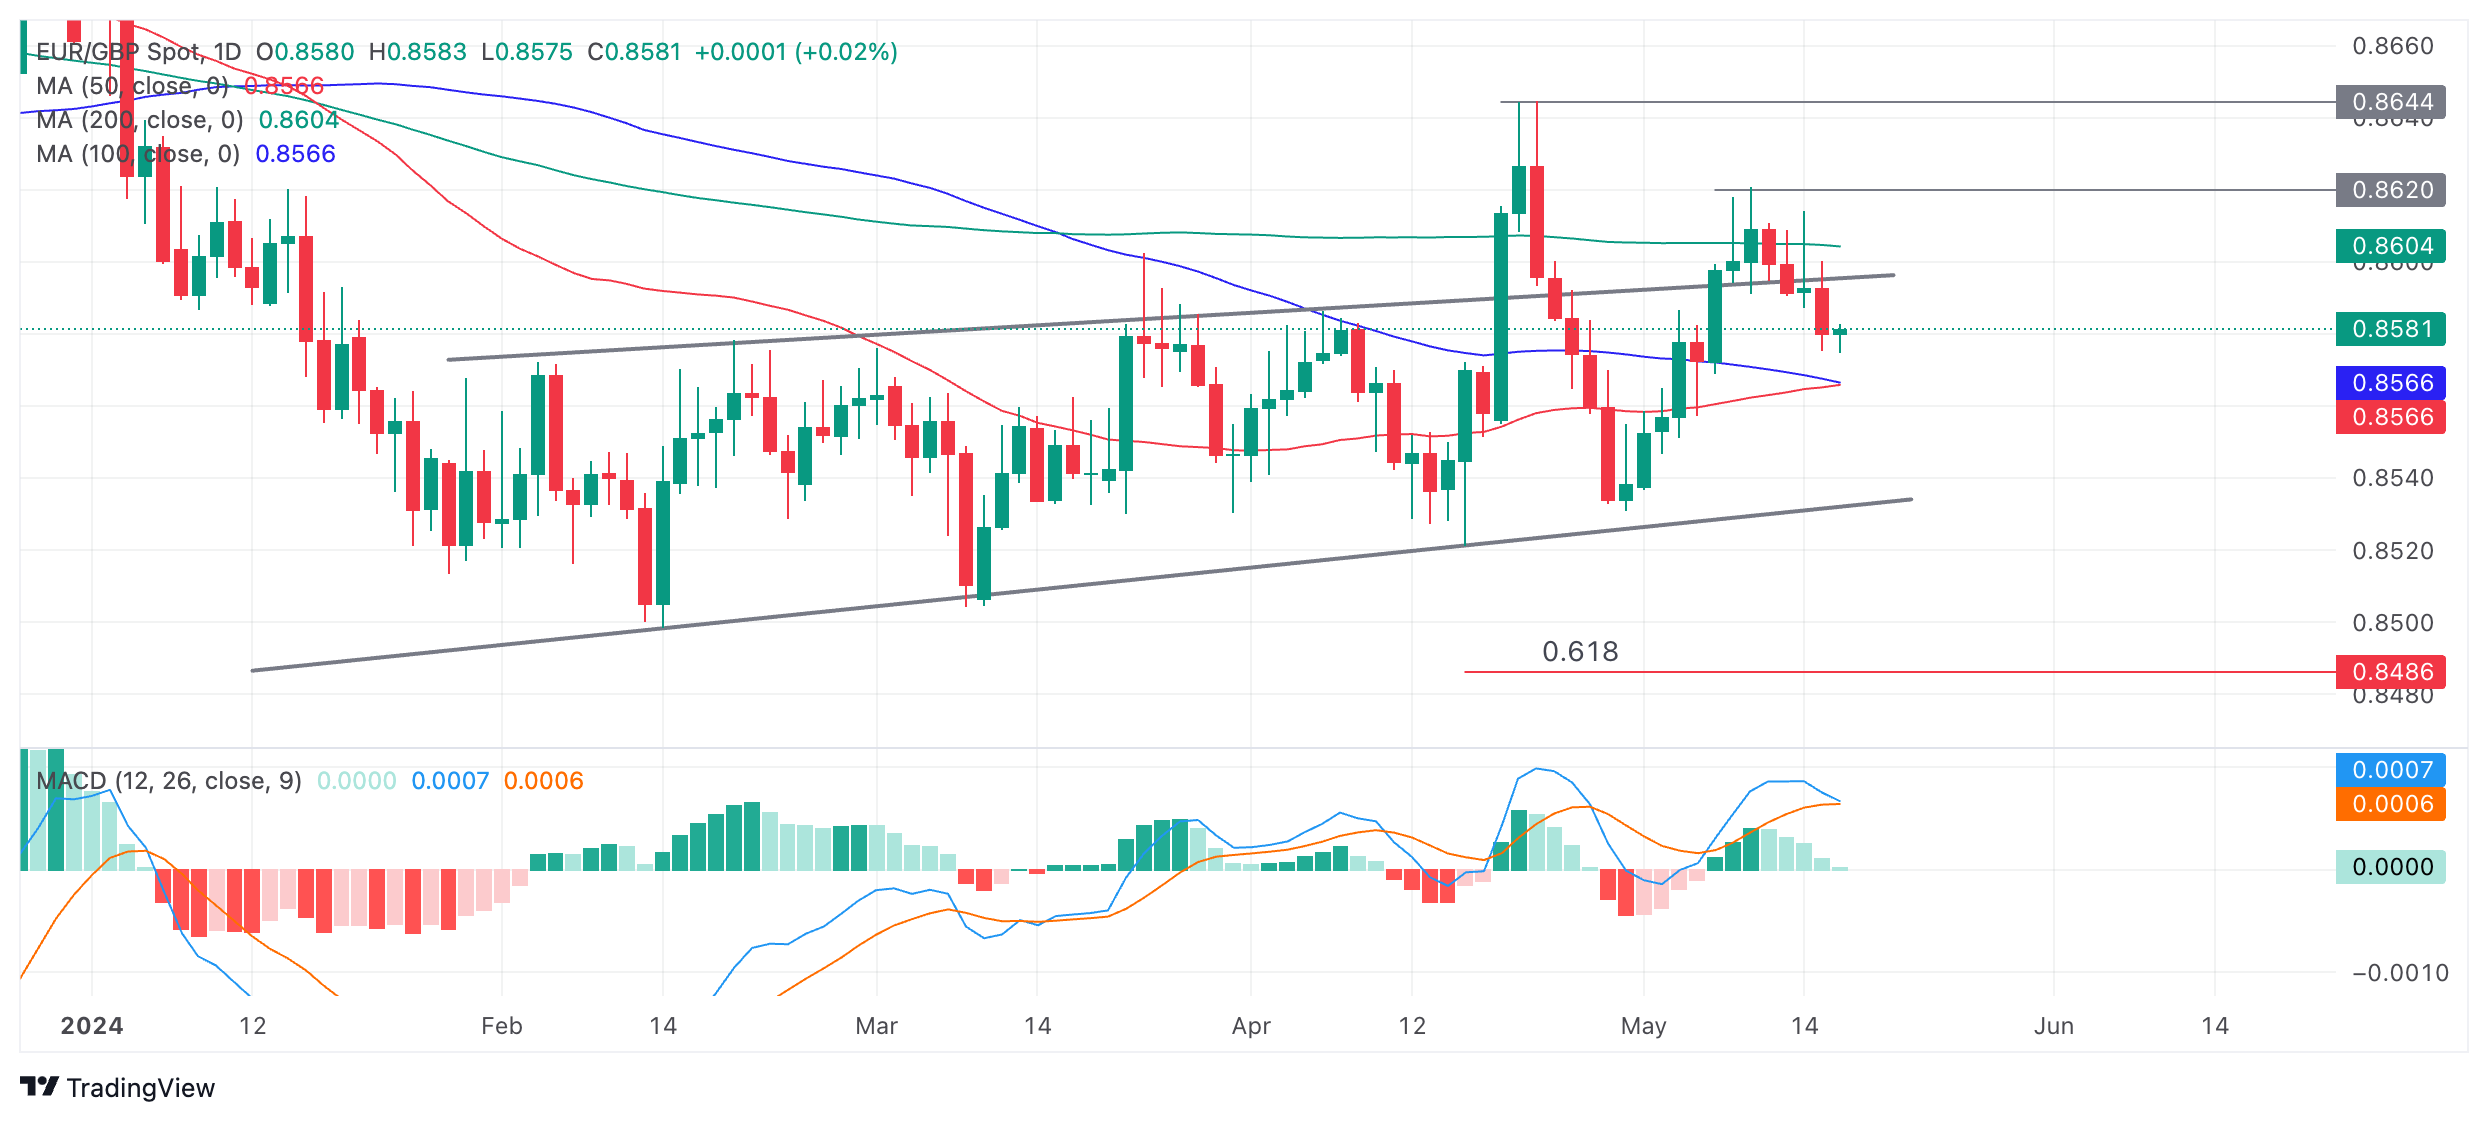
EUR/GBP has decisively broken back inside its medium-term range. There is a chance the pair could now fall back all the way down to support at around 0.8540.
Two major Moving Averages – the 50-day and 100-day Simple Moving Averages (SMA) are converging at 0.8566, however, and these are likely to act as a barrier to further downside. As such, EUR/GBP may pause if it falls to that level.
The Moving Average Convergence Divergence (MACD) indicator is threatening to cross below its red signal line. If such a cross is confirmed (on a daily close basis) it will add further bearish evidence suggesting EUR/GBP will continue descending within the range/channel.
For a change of the sideways trend, EUR/GBP would need to make a decisive break below the range lows or above the April 23 high.
In the case of a break below the range lows the first downside target would be located at 0.8486 – the 0.618 Fibonacci ratio of the height of the range extrapolated lower from the channel’s base. This is the common method used by technical analysts to estimate range breakouts. Further weakness could even see price reach the next target at 0.8460, the full height of the range extrapolated lower.
A decisive break would be one characterized by a long red candlestick that broke completely below the range floor and closed near its low, or three consecutive red candlesticks that broke clearly through the level.
The top of the range has already been breached several times suggesting it has weakened and provides a less reliable resistance level. For confirmation of a new uptrend now, EUR/GBP would need to not only break above the top of the range, but also above the April 23 peak at 0.8644. On the way up, 0.8620 (May 9 high) would supply resistance.
Author

Joaquin Monfort
FXStreet
Joaquin Monfort is a financial writer and analyst with over 10 years experience writing about financial markets and alt data. He holds a degree in Anthropology from London University and a Diploma in Technical analysis.


