- EUR/GBP trades at 0.8595, down 0.12%, as traders position for a possible ECB rate hike of 25 basis points.
- Daily chart shows a tweezers-top inverted hammer, indicating potential for further losses; key support at 50-day MA of 0.8580.
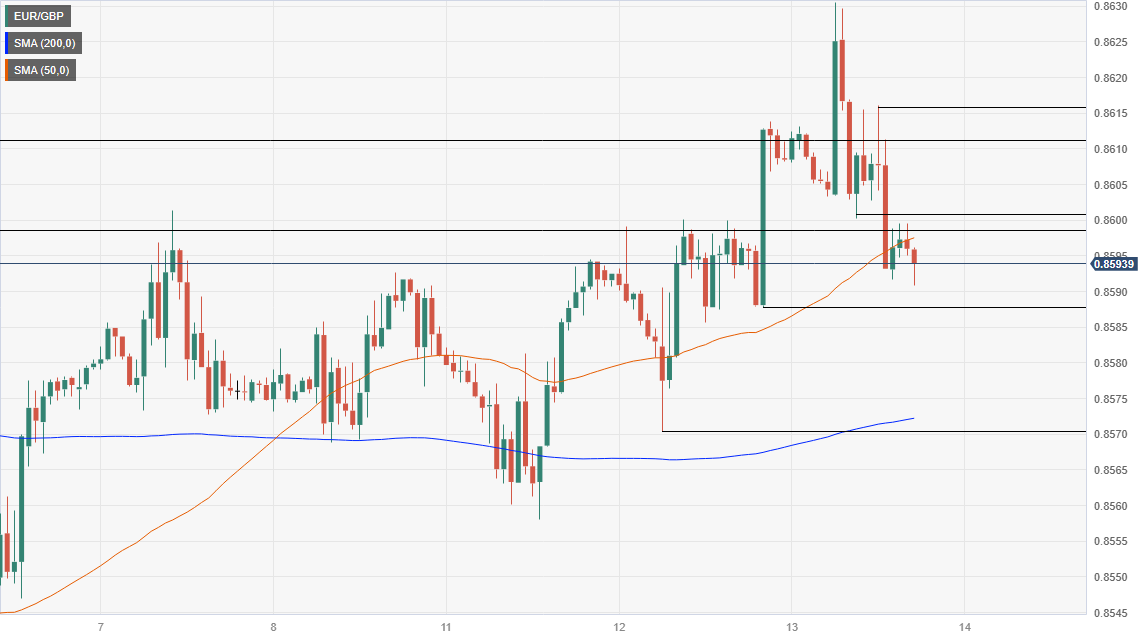
- One-hour chart suggests next support at 0.8587; resistance levels emerge at 50-HMA of 0.8598 and 0.8600 figure.
The Euro (EUR) loses territory against the Pound Sterling (GBP), as traders brace for tomorrow’s European Central Bank (ECB) monetary policy decision. Despite odds the ECB would raise rates by 25 basis points, it was no excuse for EUR/GBP traders to short the pair ahead of the meeting. The cross-currency pair exchanges hands at 0.8595, down 0.12%.
EUR/GBP Price Analysis: Technical outlook
The daily chart portrays the pair reaching a four-week high at 0.8630 but erased those gains and formed a tweezers-top inverted hammer, which could pave the way for further losses. But a daily close at around 0.8592 is needed to cement a downward correction. In that case, the cross-currency next support would be the 50-day Moving Average (DMA) at 0.8580, followed by the September 12 swing low of 0.8569. Upside risks emerge at the current week’s high of 0.8630.
The one-hour chart portrays the pair failed to extend its gains past the daily high and retreated below the previous higher-low of 0.8603, opening the door for further downside. The next support would be 0.8587, followed by the 200-hour Moving Average (HMA) at 0.8572. On the flip side, the EUR/GBP first resistance would be the 50-HMA at 0.8598, the 0.8600 figure, and the next swing high at 0.8616.
EUR/GBP Price Action – Daily chart
Information on these pages contains forward-looking statements that involve risks and uncertainties. Markets and instruments profiled on this page are for informational purposes only and should not in any way come across as a recommendation to buy or sell in these assets. You should do your own thorough research before making any investment decisions. FXStreet does not in any way guarantee that this information is free from mistakes, errors, or material misstatements. It also does not guarantee that this information is of a timely nature. Investing in Open Markets involves a great deal of risk, including the loss of all or a portion of your investment, as well as emotional distress. All risks, losses and costs associated with investing, including total loss of principal, are your responsibility. The views and opinions expressed in this article are those of the authors and do not necessarily reflect the official policy or position of FXStreet nor its advertisers. The author will not be held responsible for information that is found at the end of links posted on this page.
If not otherwise explicitly mentioned in the body of the article, at the time of writing, the author has no position in any stock mentioned in this article and no business relationship with any company mentioned. The author has not received compensation for writing this article, other than from FXStreet.
FXStreet and the author do not provide personalized recommendations. The author makes no representations as to the accuracy, completeness, or suitability of this information. FXStreet and the author will not be liable for any errors, omissions or any losses, injuries or damages arising from this information and its display or use. Errors and omissions excepted.
The author and FXStreet are not registered investment advisors and nothing in this article is intended to be investment advice.
Recommended content
Editors’ Picks
EUR/USD stays in positive territory above 1.0850 after US data

EUR/USD clings to modest daily gains above 1.0850 in the second half of the day on Friday. The improving risk mood makes it difficult for the US Dollar to hold its ground after PCE inflation data, helping the pair edge higher ahead of the weekend.
GBP/USD stabilizes above 1.2850 as risk mood improves

GBP/USD maintains recovery momentum and fluctuates above 1.2850 in the American session on Friday. The positive shift seen in risk mood doesn't allow the US Dollar to preserve its strength and supports the pair.
Gold rebounds above $2,380 as US yields stretch lower

Following a quiet European session, Gold gathers bullish momentum and trades decisively higher on the day above $2,380. The benchmark 10-year US Treasury bond yield loses more than 1% on the day after US PCE inflation data, fuelling XAU/USD's upside.
Avalanche price sets for a rally following retest of key support level

Avalanche (AVAX) price bounced off the $26.34 support level to trade at $27.95 as of Friday. Growing on-chain development activity indicates a potential bullish move in the coming days.
The election, Trump's Dollar policy, and the future of the Yen

After an assassination attempt on former President Donald Trump and drop out of President Biden, Kamala Harris has been endorsed as the Democratic candidate to compete against Trump in the upcoming November US presidential election.