|

EUR/GBP Price Analysis: Pair stabilizes at 0.8350, technical outlook remains bearish

  • EUR/GBP retraced Monday’s sharp downward movements.
  • The daily RSI and MACD signals a stabilizing selling pressure.
  • The pair might extend its current sideways trend in the next sessions.

EUR/GBP rose to 0.8370 on Wednesday, displaying some volatility during the European trading session. Nevertheless, the pair failed to hold on to gains, and it currently trades at 0.8350. The cross seems to be consolidating the start of the week’s sharp downward movements with sellers taking a breather.

The Relative Strength Index (RSI) on the daily chart stands at 37, suggesting that buyers are starting to take control after Monday’s selloff, and the RSI is gradually increasing. However, the RSI is still below the midline, indicating that the market is in a negative trend. The Moving Average Convergence Divergence (MACD) is flat, with the signal line above the MACD line, suggesting that selling is losing steam.

EUR/GBP daily chart

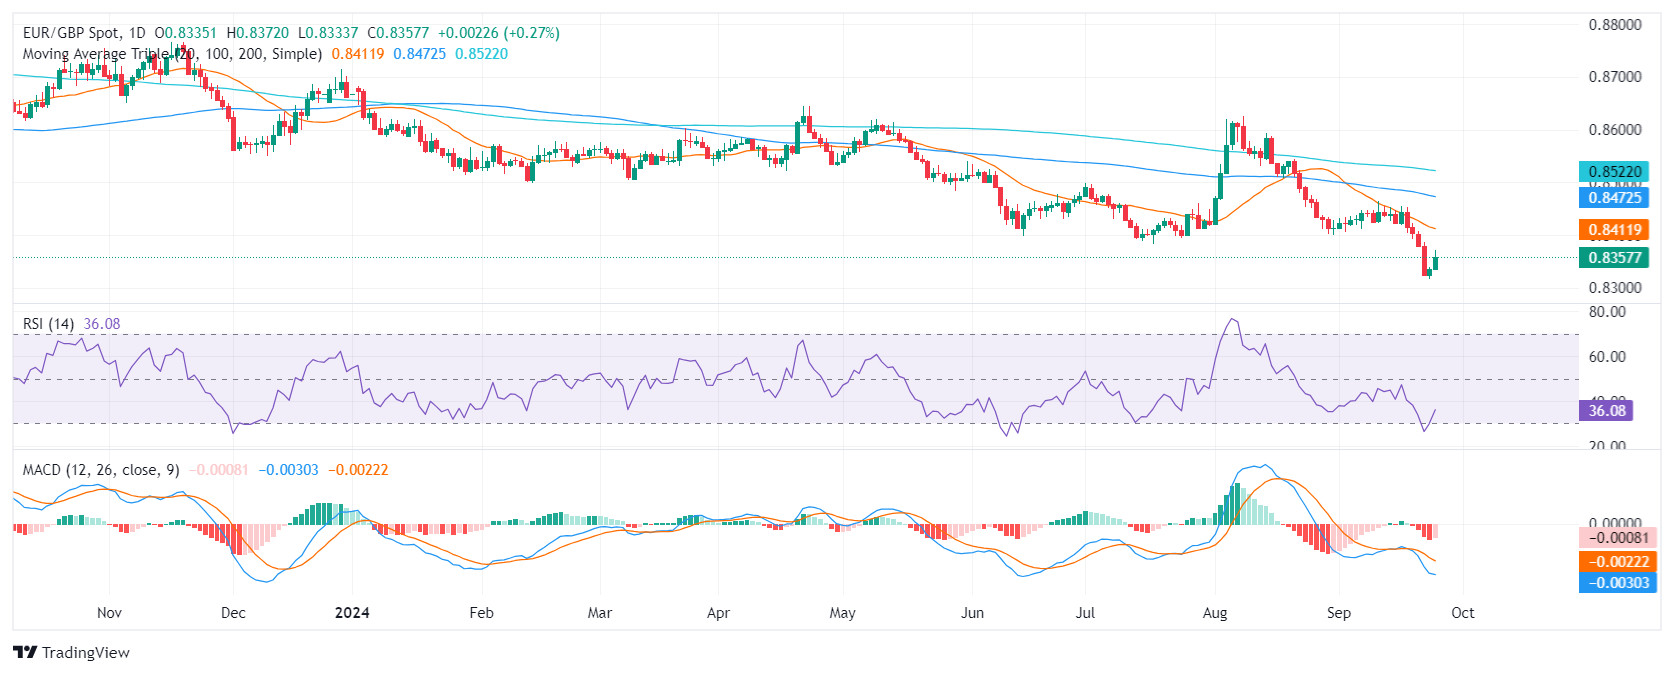
Based on the current technical picture, the EUR/GBP pair is likely to remain in a consolidation phase in the near term. With the pair in lows since 2022, the bears seem to have already done their part and they might step away to consolidate their movements. In the meantime, the bullish traction gained on Wednesday continues to be weak so the current bearish scenario isn’t threatened.

Support levels: 0.8315, 0.8330, 0.8340
Resistance levels :0.8400, 0.8430, 0.8440

Author

Patricio Martín

Patricio is an economist from Argentina passionate about global finance and understanding the daily movements of the markets.

More from Patricio Martín
Share:

Editor's Picks

EUR/USD seems fragile below 1.1700 as Middle East war boosts energy prices

The EUR/USD pair trades flat at around 1.1680 during the Asian trading session on Tuesday, but broadly seems vulnerable, being close to its five-week low. The major currency pair is under pressure as surging oil prices due to the United States-Israel war with Iran have increased the risks of higher inflation for the Old Continent.

GBP/USD hovers around 1.3400 with bearish pressure intact

GBP/USD edges higher after three days of losses, trading around 1.3400 during the Asian hours on Tuesday. The technical analysis of the daily chart indicates an ongoing bearish bias, as the pair trades within a descending channel pattern.

Gold sticks to gains above $5,350 amid sustained safe-haven demand; firmer USD caps gains

Gold sticks to its positive bias for the third straight day and trades above the $5,350 level heading into the European session on Tuesday. Concerns about a broader regional conflict in the Middle East continue to weigh on investors' sentiment and underpin demand for the traditional safe-haven bullion.

Stellar risks deeper losses as derivatives metrics turn negative

Stellar is trading red below $0.16 at the time of writing on Tuesday, after a slight recovery the previous day. Weakening derivatives data caps the recovery, while an unfavorable technical outlook projects a deeper correction for the XLM token in the upcoming days.

The market is not panicking it is repricing the probability distribution of Oil and time

At the end of the day, markets do not trade morality or geopolitics. They trade transmission channels. And the only channel that truly matters in this maelstrom runs through the price of energy and the time value of money.

Hyperliquid Price Forecast: HYPE rises on commodities demand amid US-Iran war

Hyperliquid (HYPE) steadies above $33 at press time on Tuesday, marking its fourth consecutive day of recovery in a broadly volatile market due to the ongoing US-Israel strikes on Iran.