|

EUR/GBP Price Analysis: M-formation in play, bulls eye the 0.8560s

  • Accumulation is taking place in EUR/GBP below the bearish 50 EMA channel. 
  • EUR/GBP bulls seeking a test of the M-formation's neckline. 

The following is an analysis of EUR/GBP that illustrates a bullish hypothetical scenario based on price behaviour, chart patterns and market structure. 

EUR/GBP daily chart

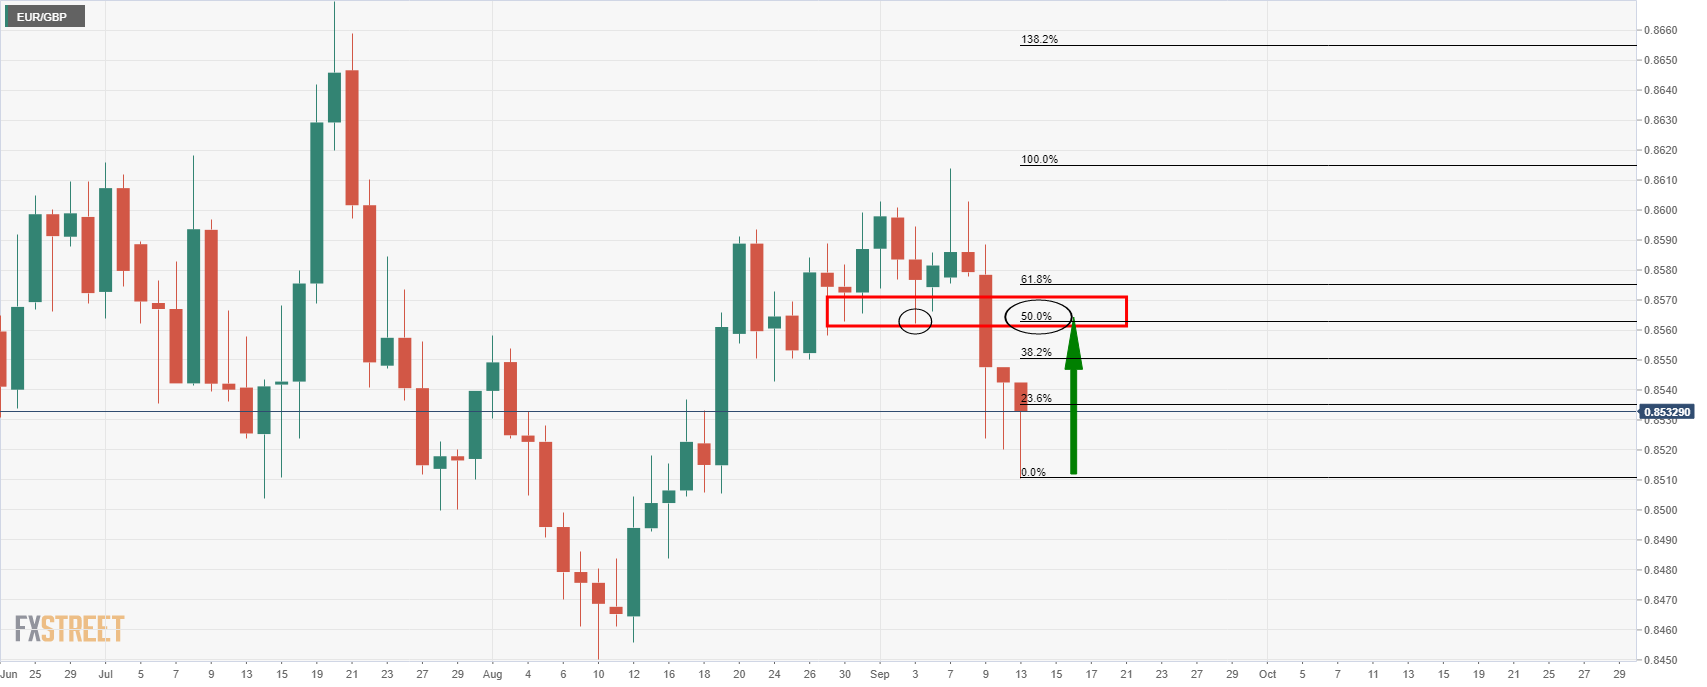
The M-formation is a bullish reversion chart pattern and has a high completion rate. The price would be expected to revert back to test the neckline of the pattern. In this case, where it meets the 50% mean reversion point near 0.8565.

EUR/GBP hourly chart

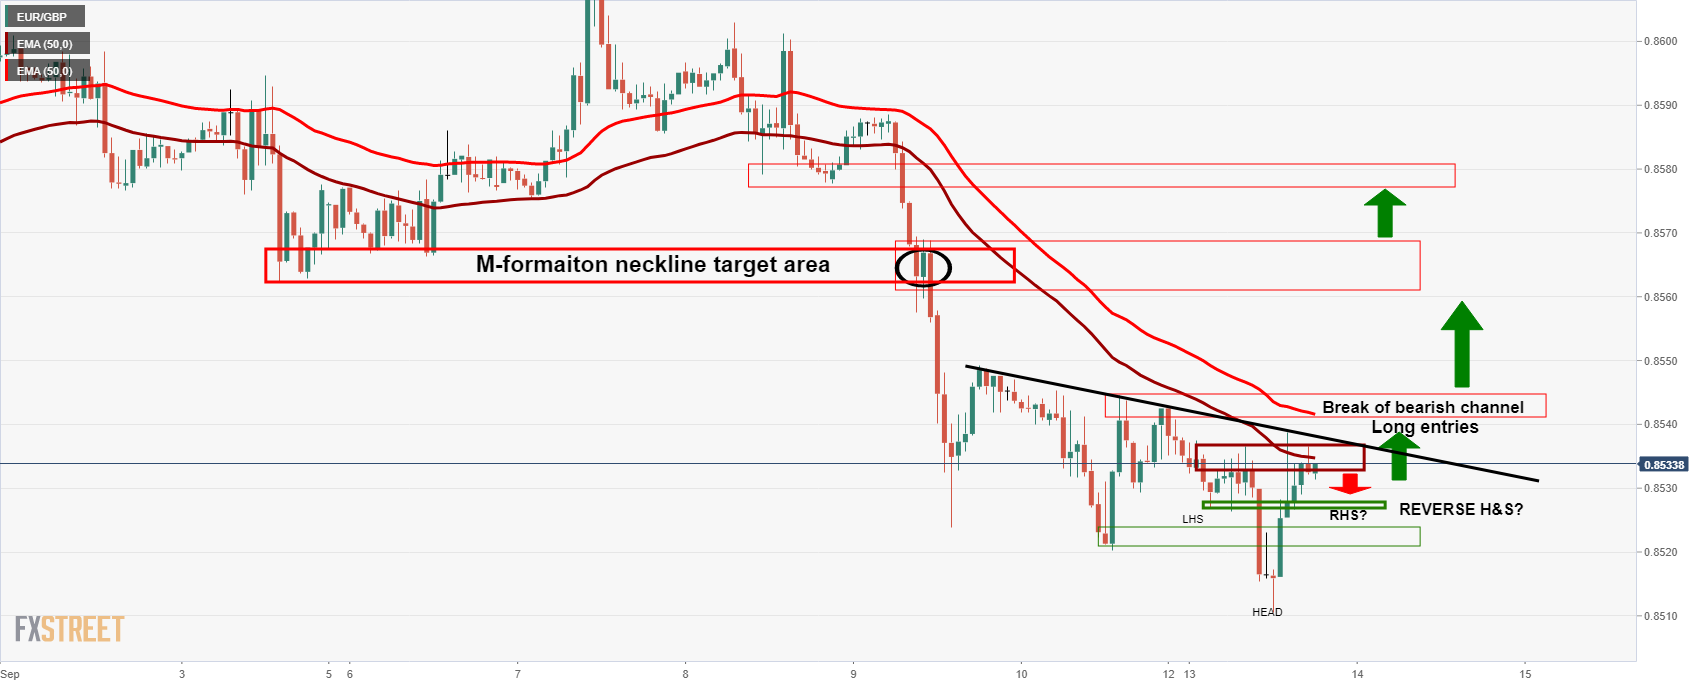
Traders can look for an entry to target the neckline from a lower time frame, such as the hourly chart. On the hourly chart, traders can monitor for bullish structure. Hypothetically, the above illustrates a bullish scenario.

At the moment, the price is buried deep below resistance, but the reverse head and shoulders pattern, a bullish formation, could be in the making. The price will need to be supported above 0.8520, resulting in a right-hand shoulder of the hand and shoulders pattern, as illustrated above. In doing so, bulls will monitor for a break of the neckline and the dynamic trendline line resistance. 

As the price moves beyond the trendline resistance, the 50 EMA channel will move from bearish to neutral and then bullish as the price continues its northerly trajectory. This could equate to further demand from buyers and help the price along the way to the target and beyond for the coming days. 

Author

Ross J Burland

Ross J Burland, born in England, UK, is a sportsman at heart. He played Rugby and Judo for his county, Kent and the South East of England Rugby team.

More from Ross J Burland
Share:

Markets move fast. We move first.

Orange Juice Newsletter brings you expert driven insights - not headlines. Every day on your inbox.

By subscribing you agree to our Terms and conditions.

Editor's Picks

EUR/USD trades with negative bias around 1.1730 amid recovering USD; downside seems limited

The EUR/USD pair kicks off the new week on a softer note, though it remains within striking distance of the highest level since early October, touched last Thursday. Spot prices currently trade around the 1.1730 region, down less than 0.10% for the day.

GBP/USD holds steady above mid-1.3300s as traders await key data and BoE this week

The GBP/USD pair remains on the defensive during the Asian session on Monday, though it lacks bearish conviction and holds above the 200-day Simple Moving Average pivotal support. Spot prices currently trade around the 1.3360 region, nearly unchanged for the day.

Gold retains bullish bias ahead of this week’s key US macro releases

Gold attracts buyers for the fifth straight day and climbs to the $4,330 region during the Asian session on Monday. The commodity remains well within striking distance of its highest level since October 21, touched on Friday, and seems poised to appreciate further amid a supportive fundamental backdrop. 

Top Crypto Losers: DASH, SPX, PENGU – Privacy and meme coins lose ground

Altcoins, including Dash, SPX6900, and Pudgy Penguins, are leading losses as the broader cryptocurrency market remains cautious ahead of the macroeconomic data releases, such as the US Nonfarm payroll report, CPI data, and the Bank of Japan’s rate-hike decision.

Big week ends with big doubts

The S&P 500 continued to push higher yesterday as the US 2-year yield wavered around the 3.50% mark following a Federal Reserve (Fed) rate cut earlier this week that was ultimately perceived as not that hawkish after all. The cut is especially boosting the non-tech pockets of the market.

Aave Price Forecast: AAVE primed for breakout as bullish signals strengthen

Aave (AAVE) price is trading above $204 at the time of writing on Friday and approaching the upper boundary of its descending parallel channel; a breakout from this structure would favor the bulls.