|

EUR/GBP Price Analysis: En route 0.8860 hurdle during four-day uptrend

  • EUR/GBP grinds near weekly high, up for the fourth consecutive day.
  • Clear rebound from 50% Fibonacci retracement, upside break of 100-SMA favor bulls.
  • One-week-old resistance line restricts immediate upside ahead of monthly top.

EUR/GBP picks up bids to 0.8845 as bulls poke intraday high, as well as the weekly top, heading into Wednesday’s European session. In doing so, the cross-currency pair rises for the fourth consecutive day after reversing from the 50% Fibonacci retracement of its run-up from early December to January 13.

In addition to a successful rebound from the key Fibonacci retracement level of 0.8722, the EUR/GBP pair’s ability to cross the 100-SMA hurdle, as well as the bullish MACD signals, favor the bulls.

It should be noted, however, that a downward-sloping resistance line from January 13, close to 0.8860 at the latest, guards the quote’s immediate upside.

That said, the quote’s run-up beyond 0.8860 could enable the EUR/GBP bulls to refresh the monthly high, currently around 0.8900. In that case, the 61.8% Fibonacci Expansion (FE) of its moves between December 01, 2022, and January 13, 2023, close to 0.8955, will gain the market’s attention.

Alternatively, pullback moves may initially aim for the 100-SMA level surrounding 0.8815 ahead of targeting the 0.8800 round figure.

Following that, the 50% Fibonacci retracement level of 0.8722 should lure the EUR/GBP bears.

In a case where the quote remains bearish past 0.8722, the 61.8% Fibonacci retracement level near 0.8680, also known as the “golden ratio”, will be crucial to watch.

EUR/GBP: Four-hour chart

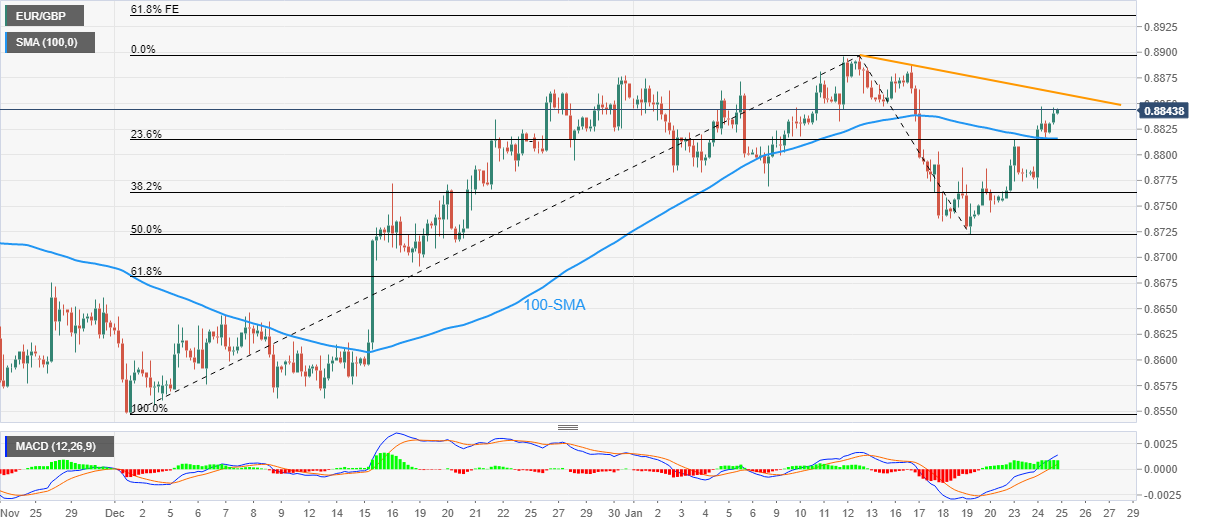
Trend: Further upside expected

Additional important levels

Overview
Today last price0.8844
Today Daily Change0.0022
Today Daily Change %0.25%
Today daily open0.8822
 
Trends
Daily SMA200.8818
Daily SMA500.8731
Daily SMA1000.8732
Daily SMA2000.8616
 
Levels
Previous Daily High0.8847
Previous Daily Low0.8767
Previous Weekly High0.8887
Previous Weekly Low0.8722
Previous Monthly High0.8877
Previous Monthly Low0.8547
Daily Fibonacci 38.2%0.8817
Daily Fibonacci 61.8%0.8798
Daily Pivot Point S10.8777
Daily Pivot Point S20.8732
Daily Pivot Point S30.8697
Daily Pivot Point R10.8857
Daily Pivot Point R20.8892
Daily Pivot Point R30.8937

Author

Anil Panchal

Anil Panchal

FXStreet

Anil Panchal has nearly 15 years of experience in tracking financial markets. With a keen interest in macroeconomics, Anil aptly tracks global news/updates and stays well-informed about the global financial moves and their implications.

More from Anil Panchal
Share:

Editor's Picks

EUR/USD keeps the offered stance just above 1.1700

EUR/USD is coming under heavy selling pressure in what has been a rather grim start to the new trading week, with the pair now trading close to the 1.1700 support area as the US Dollar stages a solid rebound. The prevailing flight to safety mood continues to favour the Greenback, as investors react to the escalating conflict in the Middle East and trim risk exposure across the board.

GBP/USD hits new yearly lows near 1.3300

GBP/USD adds to the recent bearish tone, approaching to the key 1.3300 support to reach fresh YTD troughs against the backdrop of the robust performance of the US Dollar. Indeed, Cable’s decline comes amid the firm demand for the safe-haven space in the wake of the US and Israel attacks to Iran.

Gold trims losses, back below $5,400

Gold now surrenders part of the earlier advance past the $5,400 mark per troy ounce at the beginning of the week. Indeed, the precious metal’s strong uptick remains fuelled by increasing geopolitical tensions in the Middle East amid the intense demand for safer assets.

Bitcoin on brink of breakdown amid US-Iran war

Bitcoin (BTC) remains under pressure near the key support level of $65,700. Trading at $66,400 at the time of writing on Monday, a breakdown below this critical level would suggest a deeper correction ahead.

The Fed is finally talking about AI – Here's why it matters for the US Dollar

AI is moving from earnings calls into the heart of monetary policy discussions, forcing Federal Reserve officials to confront a new question: How to act if AI reshapes inflation, employment and interest rates at the same time?

Grass 20% bullish breakout defies broader market weakness

Grass (GRASS) is edging up above $0.30 at the time of writing on Monday. The token’s notable 20% intraday surge stands out amid heightened volatility in the broader crypto market.