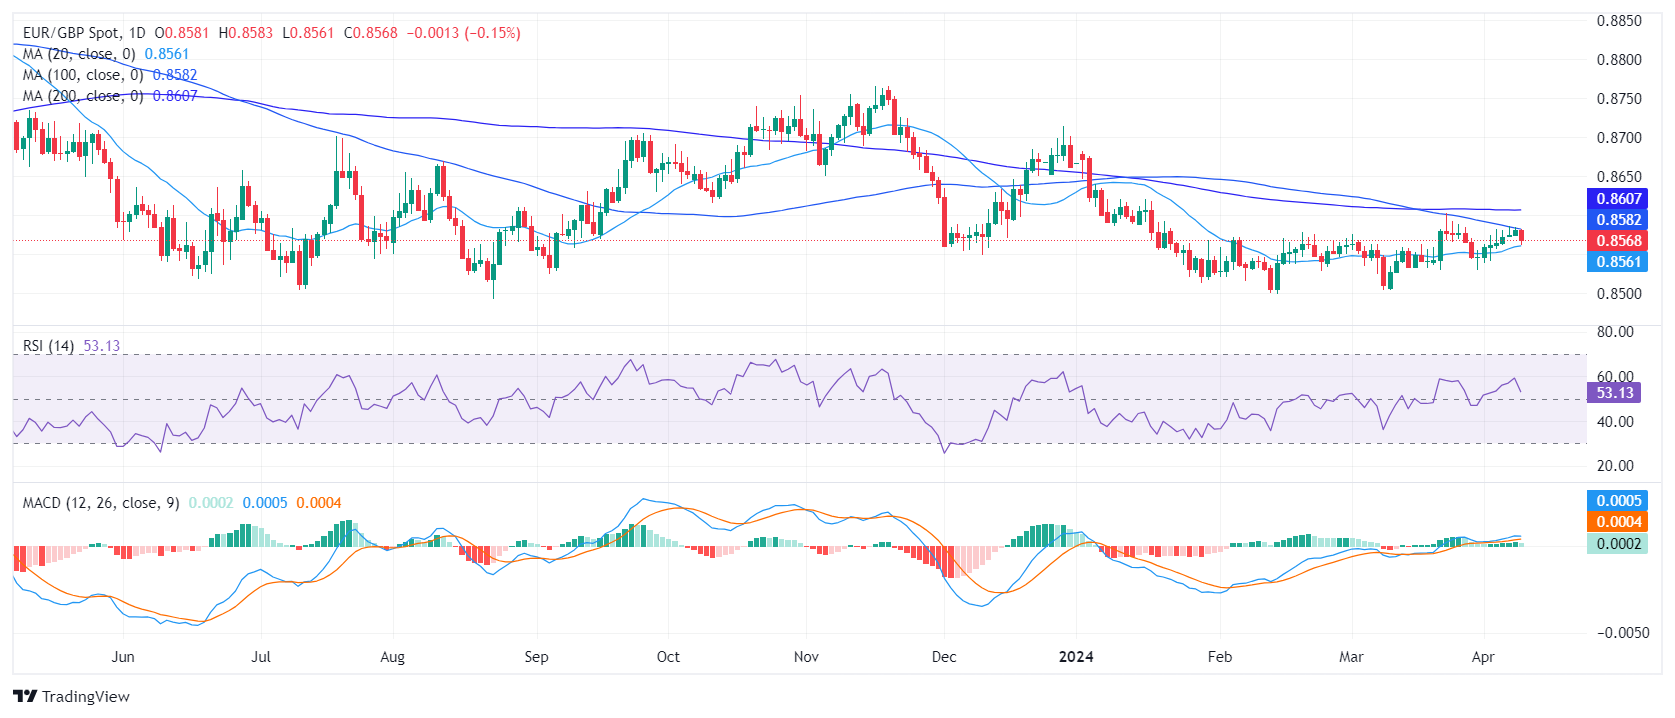
- The EUR/GBP daily chart reveals a consolidating bullish momentum.
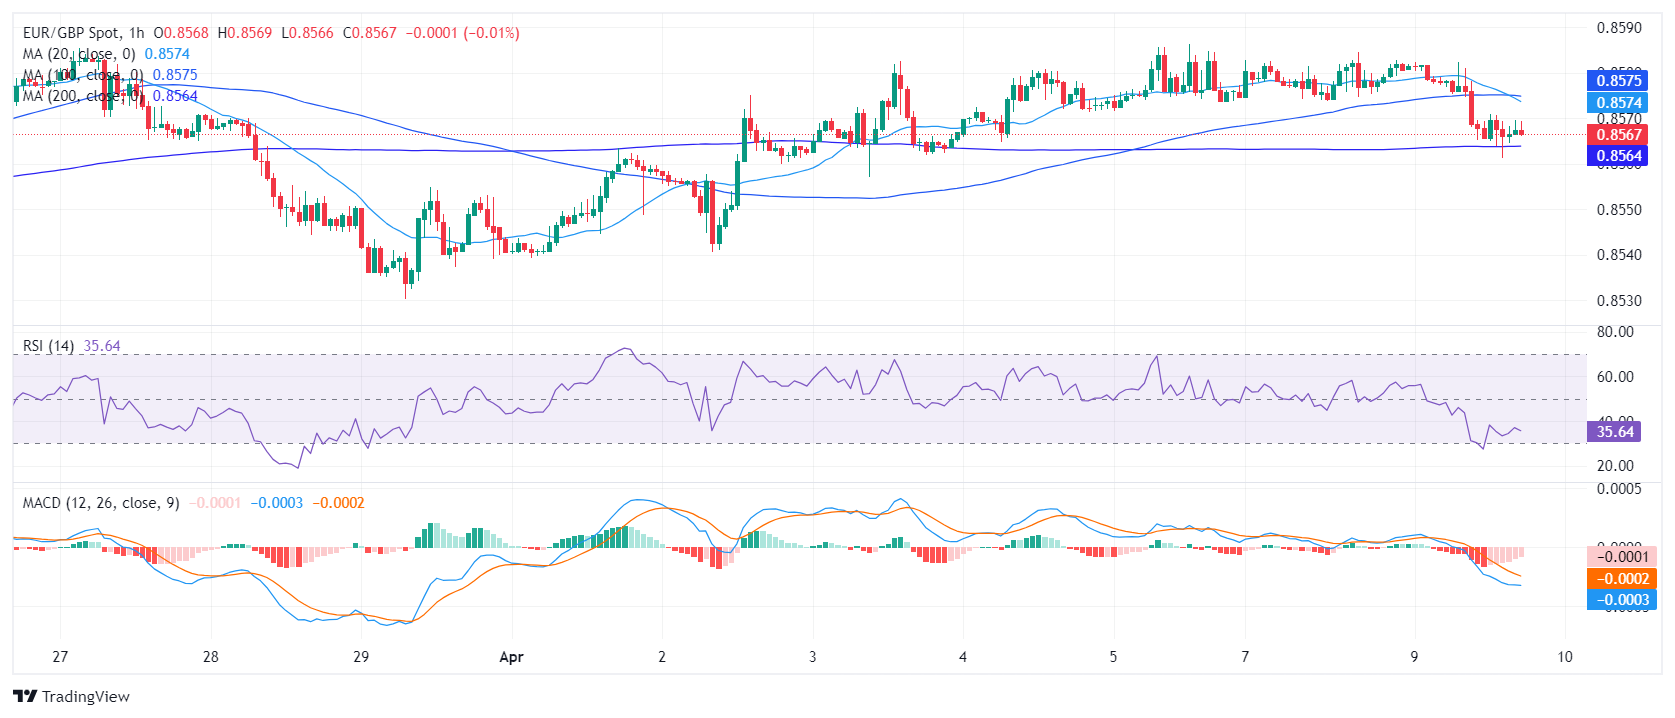
- In the hourly chart, the EUR/GBP portrays weaker buying traction, with RSI declining deep into negative terrain.
- The pair remaining above the 20-day SMA reveals a short-term bullish bias.
- The cross encountered strong resistance at 0.8580 at the 100-day SMA.
The EUR/GBP pair is currently trading at 0.8566, seeing mild losses. Despite the recent positive momentum, there is a notable resistance at the 0.8580 level, potentially capping further rise. Moreover, the pair remains under key long-term Simple Moving Averages (SMAs), suggesting that any potential gains could face strong resistance due to the overarching bearish sentiments.
On the daily chart, the Relative Strength Index (RSI) shows that the EUR/GBP pair is manifesting positive momentum in bullish territory. The most recent RSI reading for today's session reveals a minor decline to 53, suggesting that despite a slight consolidating buyers possess a slight edge over sellers. The Moving Average Convergence Divergence (MACD) histogram exhibits flat green bars, indicating a consistent positive momentum behind the pair's recent movements.
EUR/GBP daily chart
In contrast, the hourly chart for the EUR/GBP pair displays a disparate picture, with recent RSI readings falling deep in negative territory, towards 35. Given the downward RSI trend and the MACD histogram exhibiting flat red bars, short-term momentum appears to lean toward sellers.
EUR/GBP hourly chart
Observing the wider perspective, the EUR/GBP stands above its 20-day Simple Moving Average (SMA), indicative of a short-term bullish inclination. However, this movement is checked by the prospective resistance at the 100-day SMA at the 0.8580 mark, which could restrict further upward progression. Echoing a longer-term concern, the pair currently resides below its 200-day SMA, signaling a sustained bearish trend. This positioning suggests increasingly robust selling pressure over time, as the EUR/GBP has failed to escalate beyond the significant 100-day SMA. That being said, if buyers hold their momentum on the daily chart and regain the mentioned SMA, the outlook might shift in favor of the buyers.
Information on these pages contains forward-looking statements that involve risks and uncertainties. Markets and instruments profiled on this page are for informational purposes only and should not in any way come across as a recommendation to buy or sell in these assets. You should do your own thorough research before making any investment decisions. FXStreet does not in any way guarantee that this information is free from mistakes, errors, or material misstatements. It also does not guarantee that this information is of a timely nature. Investing in Open Markets involves a great deal of risk, including the loss of all or a portion of your investment, as well as emotional distress. All risks, losses and costs associated with investing, including total loss of principal, are your responsibility. The views and opinions expressed in this article are those of the authors and do not necessarily reflect the official policy or position of FXStreet nor its advertisers. The author will not be held responsible for information that is found at the end of links posted on this page.
If not otherwise explicitly mentioned in the body of the article, at the time of writing, the author has no position in any stock mentioned in this article and no business relationship with any company mentioned. The author has not received compensation for writing this article, other than from FXStreet.
FXStreet and the author do not provide personalized recommendations. The author makes no representations as to the accuracy, completeness, or suitability of this information. FXStreet and the author will not be liable for any errors, omissions or any losses, injuries or damages arising from this information and its display or use. Errors and omissions excepted.
The author and FXStreet are not registered investment advisors and nothing in this article is intended to be investment advice.
Recommended content
Editors’ Picks
EUR/USD stays in positive territory above 1.0850 after US data

EUR/USD clings to modest daily gains above 1.0850 in the second half of the day on Friday. The improving risk mood makes it difficult for the US Dollar to hold its ground after PCE inflation data, helping the pair edge higher ahead of the weekend.
GBP/USD stabilizes above 1.2850 as risk mood improves

GBP/USD maintains recovery momentum and fluctuates above 1.2850 in the American session on Friday. The positive shift seen in risk mood doesn't allow the US Dollar to preserve its strength and supports the pair.
Gold rebounds above $2,380 as US yields stretch lower

Following a quiet European session, Gold gathers bullish momentum and trades decisively higher on the day above $2,380. The benchmark 10-year US Treasury bond yield loses more than 1% on the day after US PCE inflation data, fuelling XAU/USD's upside.
Avalanche price sets for a rally following retest of key support level

Avalanche (AVAX) price bounced off the $26.34 support level to trade at $27.95 as of Friday. Growing on-chain development activity indicates a potential bullish move in the coming days.
The election, Trump's Dollar policy, and the future of the Yen

After an assassination attempt on former President Donald Trump and drop out of President Biden, Kamala Harris has been endorsed as the Democratic candidate to compete against Trump in the upcoming November US presidential election.