|

EUR/GBP Price Analysis: Breakdown from multi-month range

  • EUR/GBP is breaking down out of a multi-month range it has been oscillating within since February. 
  • If price holds below the range lows it could lead to a substantial extension lower. 
  • A break back above the highs of the breakout candle would indicate the break was false.

EUR/GBP has fallen to the floor of a multi-month range and broken decisively below on a 4-hour period closing basis. 

A close below the 0.8513 low of the candle that pierced through the floor would provide added confirmation of more downside. 

EUR/GBP 4-hour Chart 


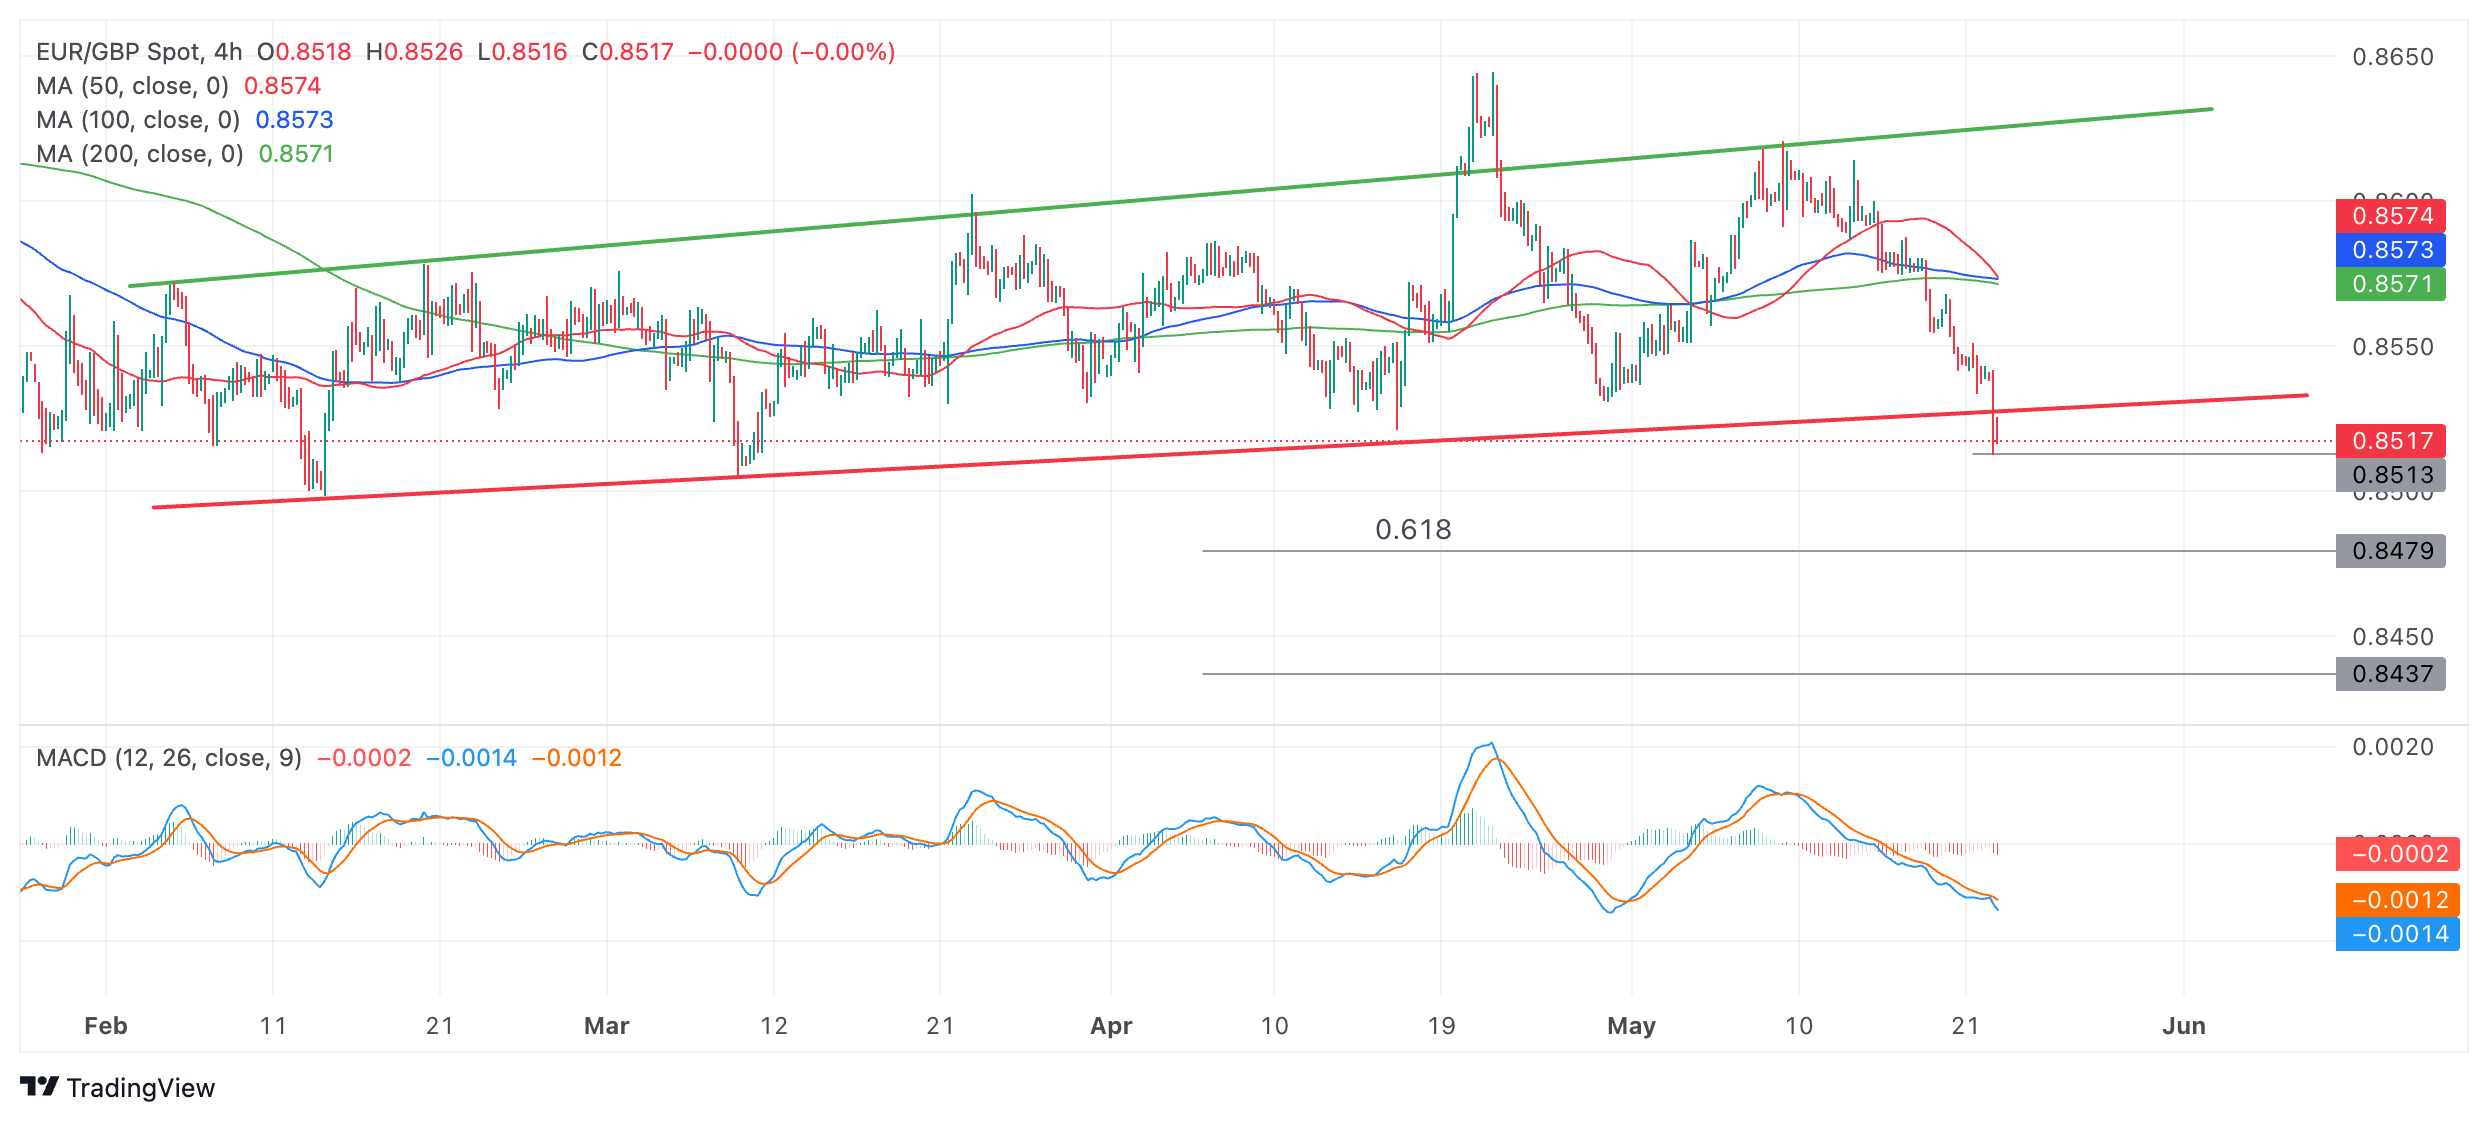
The customary method for forecasting how far a breakout move will go is to take the height of the range and extrapolate it lower from the breakout point. This gives two targets: a conservative objective at the 0.618 Fibonacci ratio – and a more optimistic target at the full 100% of the height of the range extrapolated lower. 

The conservative target lies at roughly 0.8479 and the more optimistic objective at 0.8437. 

The Moving Average Convergence Divergence (MACD) indicator is in the negative zone and looking a little oversold. If it crosses back above the signal line it could signal a recovery. Crosses of the MACD above or below its signal line have been a reliable indicator of oscillations in price during the unfolding of the range. 

There is a risk the break is a “false break” and price will recover and move back up inside the range. EUR/GBP is, after all, in a sideways trend, and “the trend is your friend”. A close back above the 0.8542 high of the breakdown candle would provide evidence the sideways trend is probably extending further. It would suggest a strong possibility of a move back up to the range high in the 0.8620s.

Author

Joaquin Monfort

Joaquin Monfort is a financial writer and analyst with over 10 years experience writing about financial markets and alt data. He holds a degree in Anthropology from London University and a Diploma in Technical analysis.

More from Joaquin Monfort
Share:

Editor's Picks

EUR/USD weakens to near 1.1900 as traders eye US data

EUR/USD eases to near 1.1900 in Tuesday's European trading hours, snapping the two-day winning streak. Markets turn cautious, lifting the haven demand for the US Dollar ahead of the release of key US economic data, including Retail Sales and ADP Employment Change 4-week average.

GBP/USD stays in the red below 1.3700 on renewed USD demand

GBP/USD trades on a weaker note below 1.3700 in the European session on Tuesday. The pair faces challenges due to renewed US Dollar demand, UK political risks and rising expectations of a March Bank of England rate cut. The immediate focus is now on the US Retail Sales data. 

Gold sticks to modest losses above $5,000 ahead of US data

Gold sticks to modest intraday losses through the first half of the European session, though it holds comfortably above the $5,000 psychological mark and the daily swing low. The outcome of Japan's snap election on Sunday removes political uncertainty, which along with signs of easing tensions in the Middle East, remains supportive of the upbeat market mood. This turns out to be a key factor exerting downward pressure on the safe-haven precious metal.

Bitcoin Cash trades lower, risks dead-cat bounce amid bearish signals

Bitcoin Cash trades in the red below $522 at the time of writing on Tuesday, after multiple rejections at key resistance. BCH’s derivatives and on-chain indicators point to growing bearish sentiment and raise the risk of a dead-cat bounce toward lower support levels.

Follow the money, what USD/JPY in Tokyo is really telling you

Over the past two Tokyo sessions, this has not been a rate story. Not even close. Interest rate differentials have been spectators, not drivers. What has moved USD/JPY in local hours has been flow and flow alone.

Bitcoin Cash trades lower, risks dead-cat bounce amid bearish signals

Bitcoin Cash (BCH) trades in the red below $522 at the time of writing on Tuesday, after multiple rejections at key resistance. BCH’s derivatives and on-chain indicators point to growing bearish sentiment and raise the risk of a dead-cat bounce toward lower support levels.